Volumetric Time
2026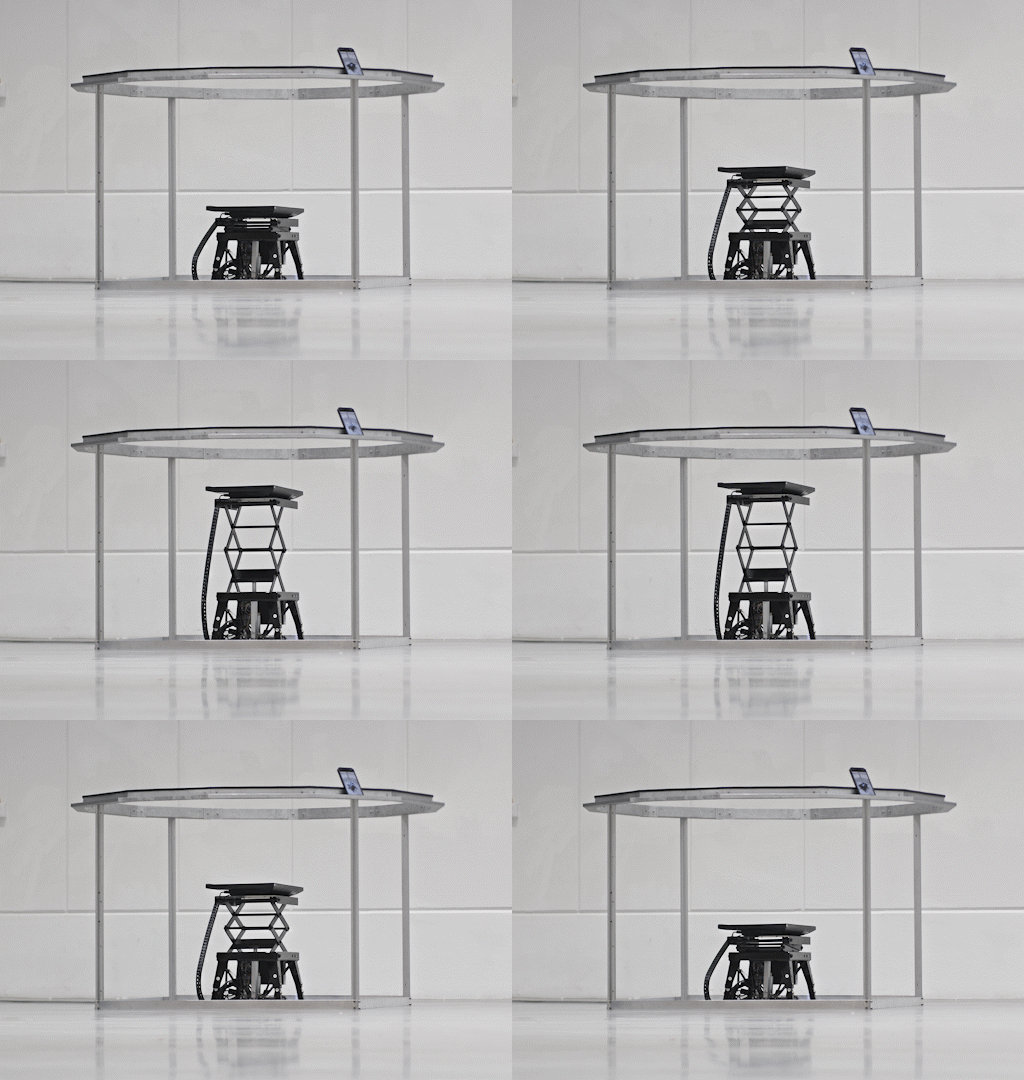
DESCRIPTION
Volumetric Time is an installation and image-making tool that uses movement and long-exposure photography to create a spatial image.
The project began with research into different types of computing. I came across drawing machines like the harmonograph and Lissajous figure machines that use physical principles to compute an image. It got me thinking about how drawing machines could use 3D space as a canvas. With long-exposure photography, one can light-paint images into empty space. I wondered if a screen, rather than a point light, could “sweep” an image sequence into a volume, and if I could thereby treat time as a sculptural axis.
I liked the idea of making movements that are too slow to be perceived by humans visible through long-exposure or time-lapse photography. A sequence of photos played in rapid succession gives the illusion of motion due to the persistence of vision. Motion blur, on the other hand, can show the duration of a movement in a single photograph. I wanted to use the third dimension to visualize time in a similar way.
Instead of trying to create persistence of vision in the human eye, the project uses a monitor that slowly moves vertically through space. While the monitor moves, it displays a sequence of image slices. When this movement is photographed with a long exposure, the individual slices accumulate into one image and appear as a three-dimensional volume.
The focus is not only on seeing a finished 3D shape, but on making the process visible. A two-dimensional image becomes a spatial structure through motion, time, and photography.
The project explores the relationship between time and space. Each visible volume is not present all at once. It is built over time from many two-dimensional moments.
The final photograph compresses this movement into a single image, so time becomes visible as spatial structure. In this way, the installation uses photography not only to document the object but also as an essential part of the display system.
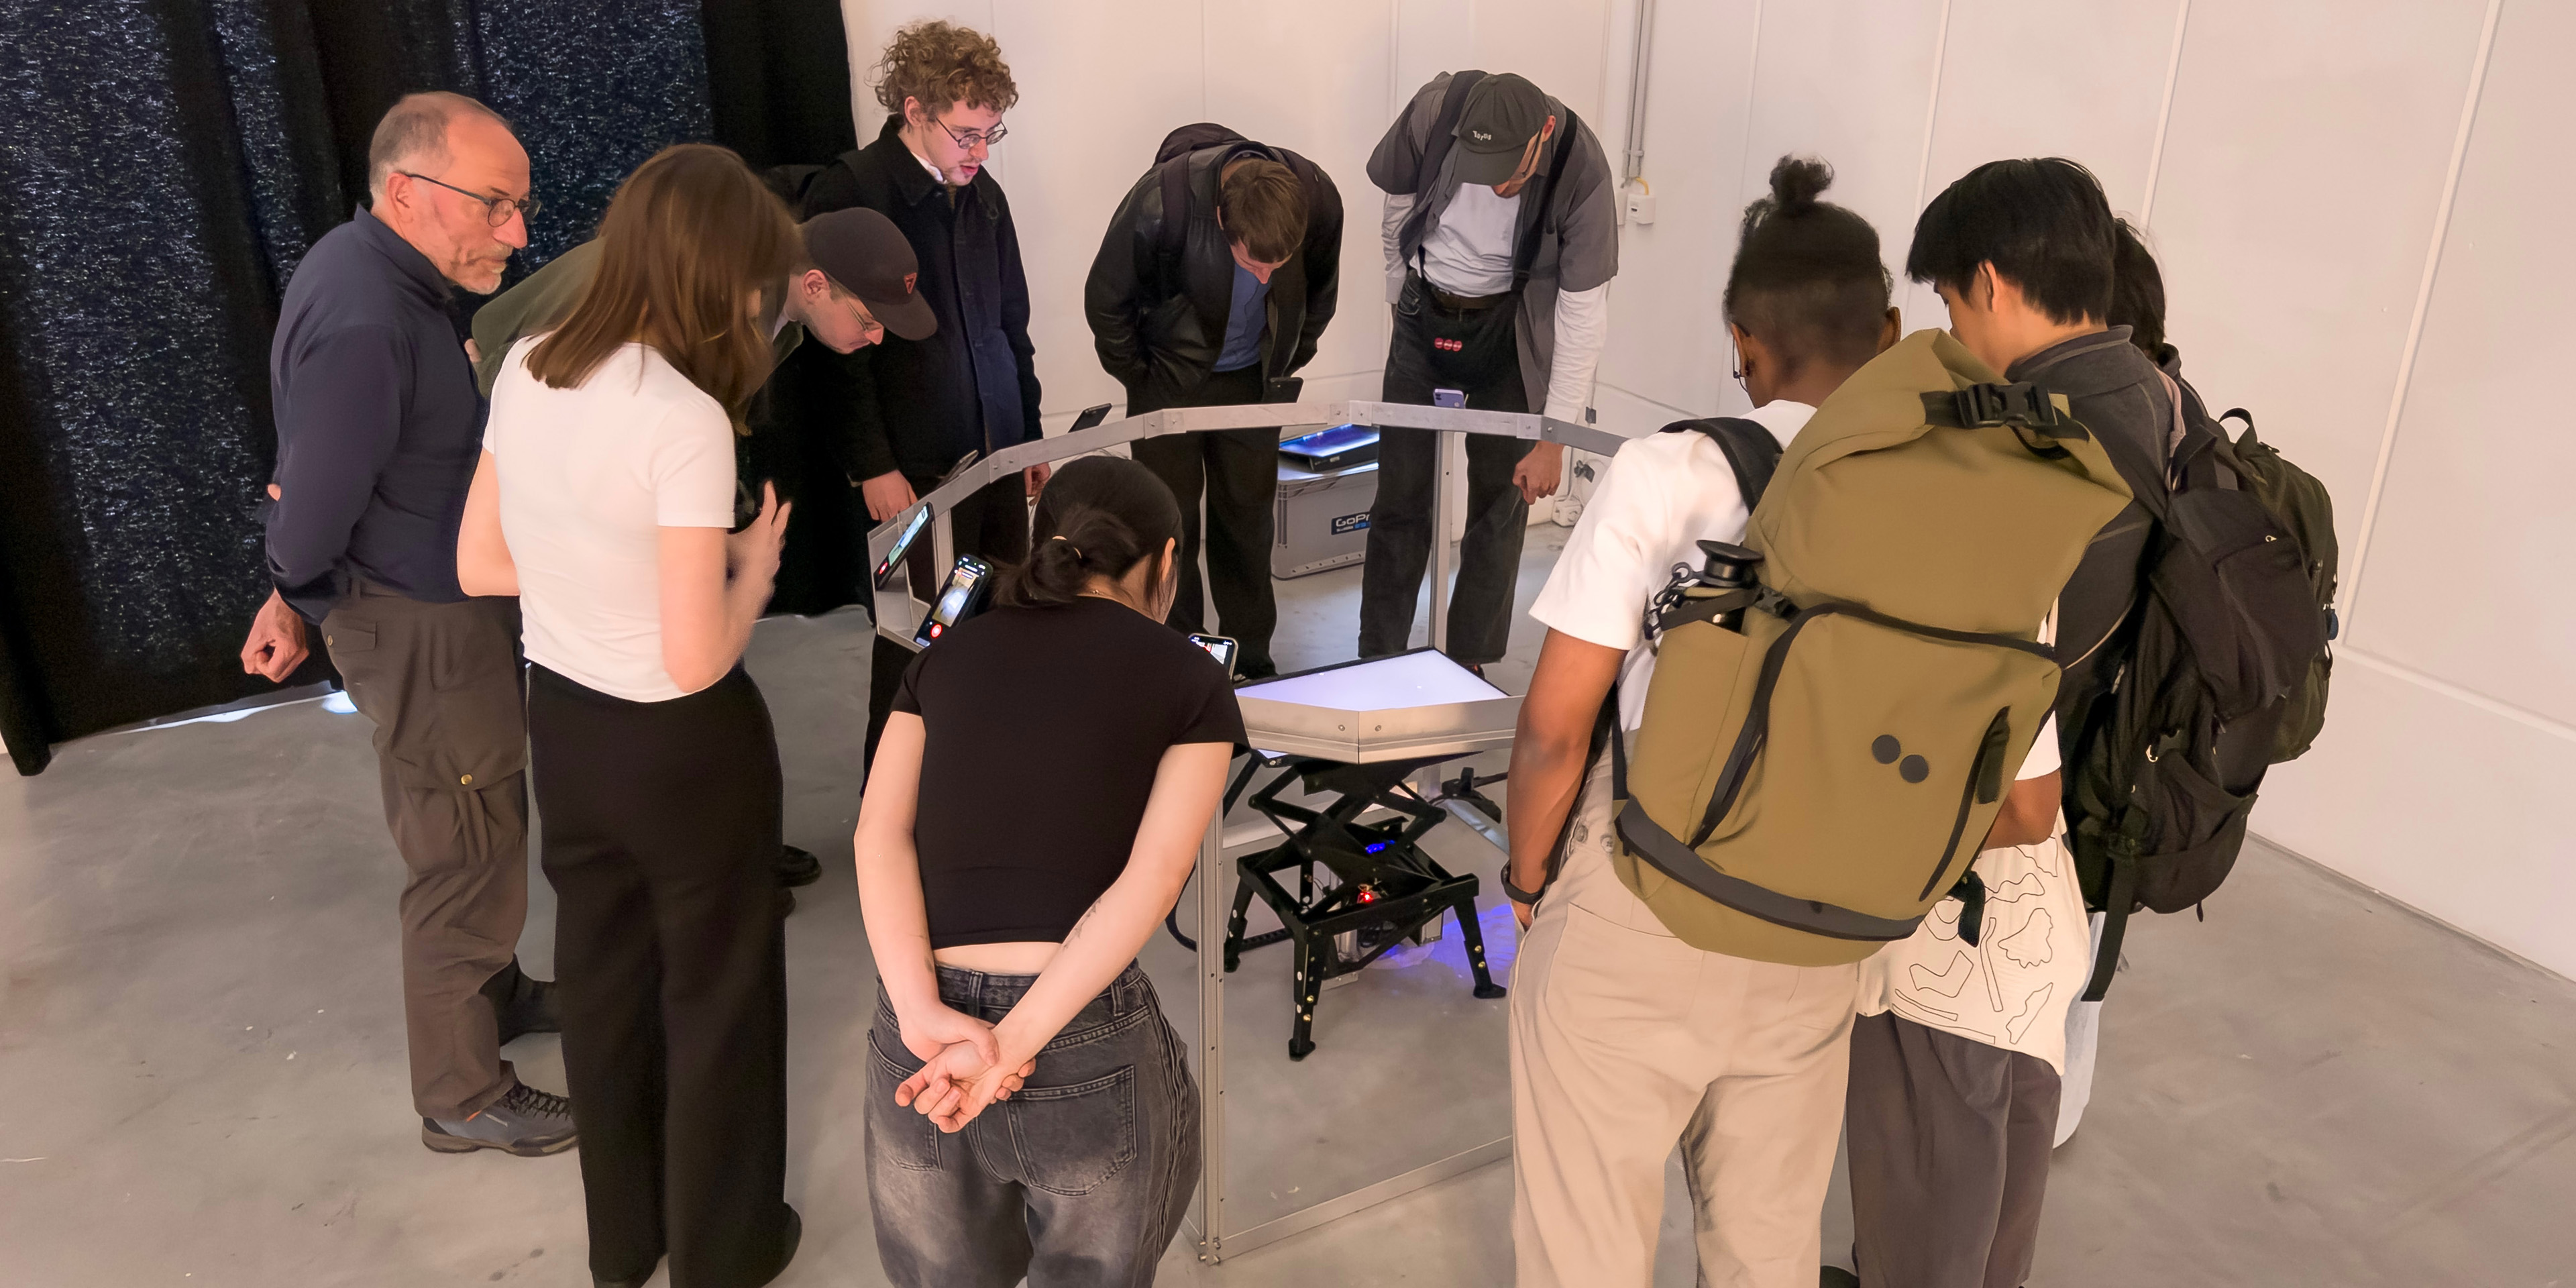
For the installation, I wanted this process to be accessible to visitors. Instead of using only one fixed camera, I involved the visitors’ own smartphone cameras. They can scan a QR code, place their phone on the surrounding structure, and capture their own long-exposure image. This makes the result dependent on the position of the viewer and turns the act of photographing into part of the interaction.
The workflow of the project can be divided into three parts: creating frame sequences, playing them on the moving display, and capturing the result with long-exposure photography. 3D models, scans, videos, or datasets are first converted into image sequences. These sequences are checked and adjusted with the visualizer, then copied to the Raspberry Pi. The Raspberry Pi controls the lift and displays the correct frame for each height of the monitor. Visitors use the browser-based camera app to capture the movement as a stacked long-exposure image.
Early Experiments
I first made a Processing sketch that stacks frames of a video chronologically along an axis in 3D space and keys out a color. I used images of a morphing video-feedback fractal. The frames are still two-dimensional, so when looking at the edge, one can see through the sculpture, but from the right angle, it gives the illusion of a continuous shape. A physical long exposure would produce motion blur, connecting the gaps between the changing frames like glue and creating a continuous light sculpture. It would also interact with the surrounding environment through reflection, scattering, and refraction.
For some first viability tests, I put a computer monitor on a piece of cloth and slid it by hand while taking long-exposure photos. I wrote a few Processing sketches of simple oscillating lines, orbiting circles, and phasing grids, and played them on a loop in full screen. As the screen moved, the two-dimensional patterns turned into volumetric ribbons, spirals, and shapes.
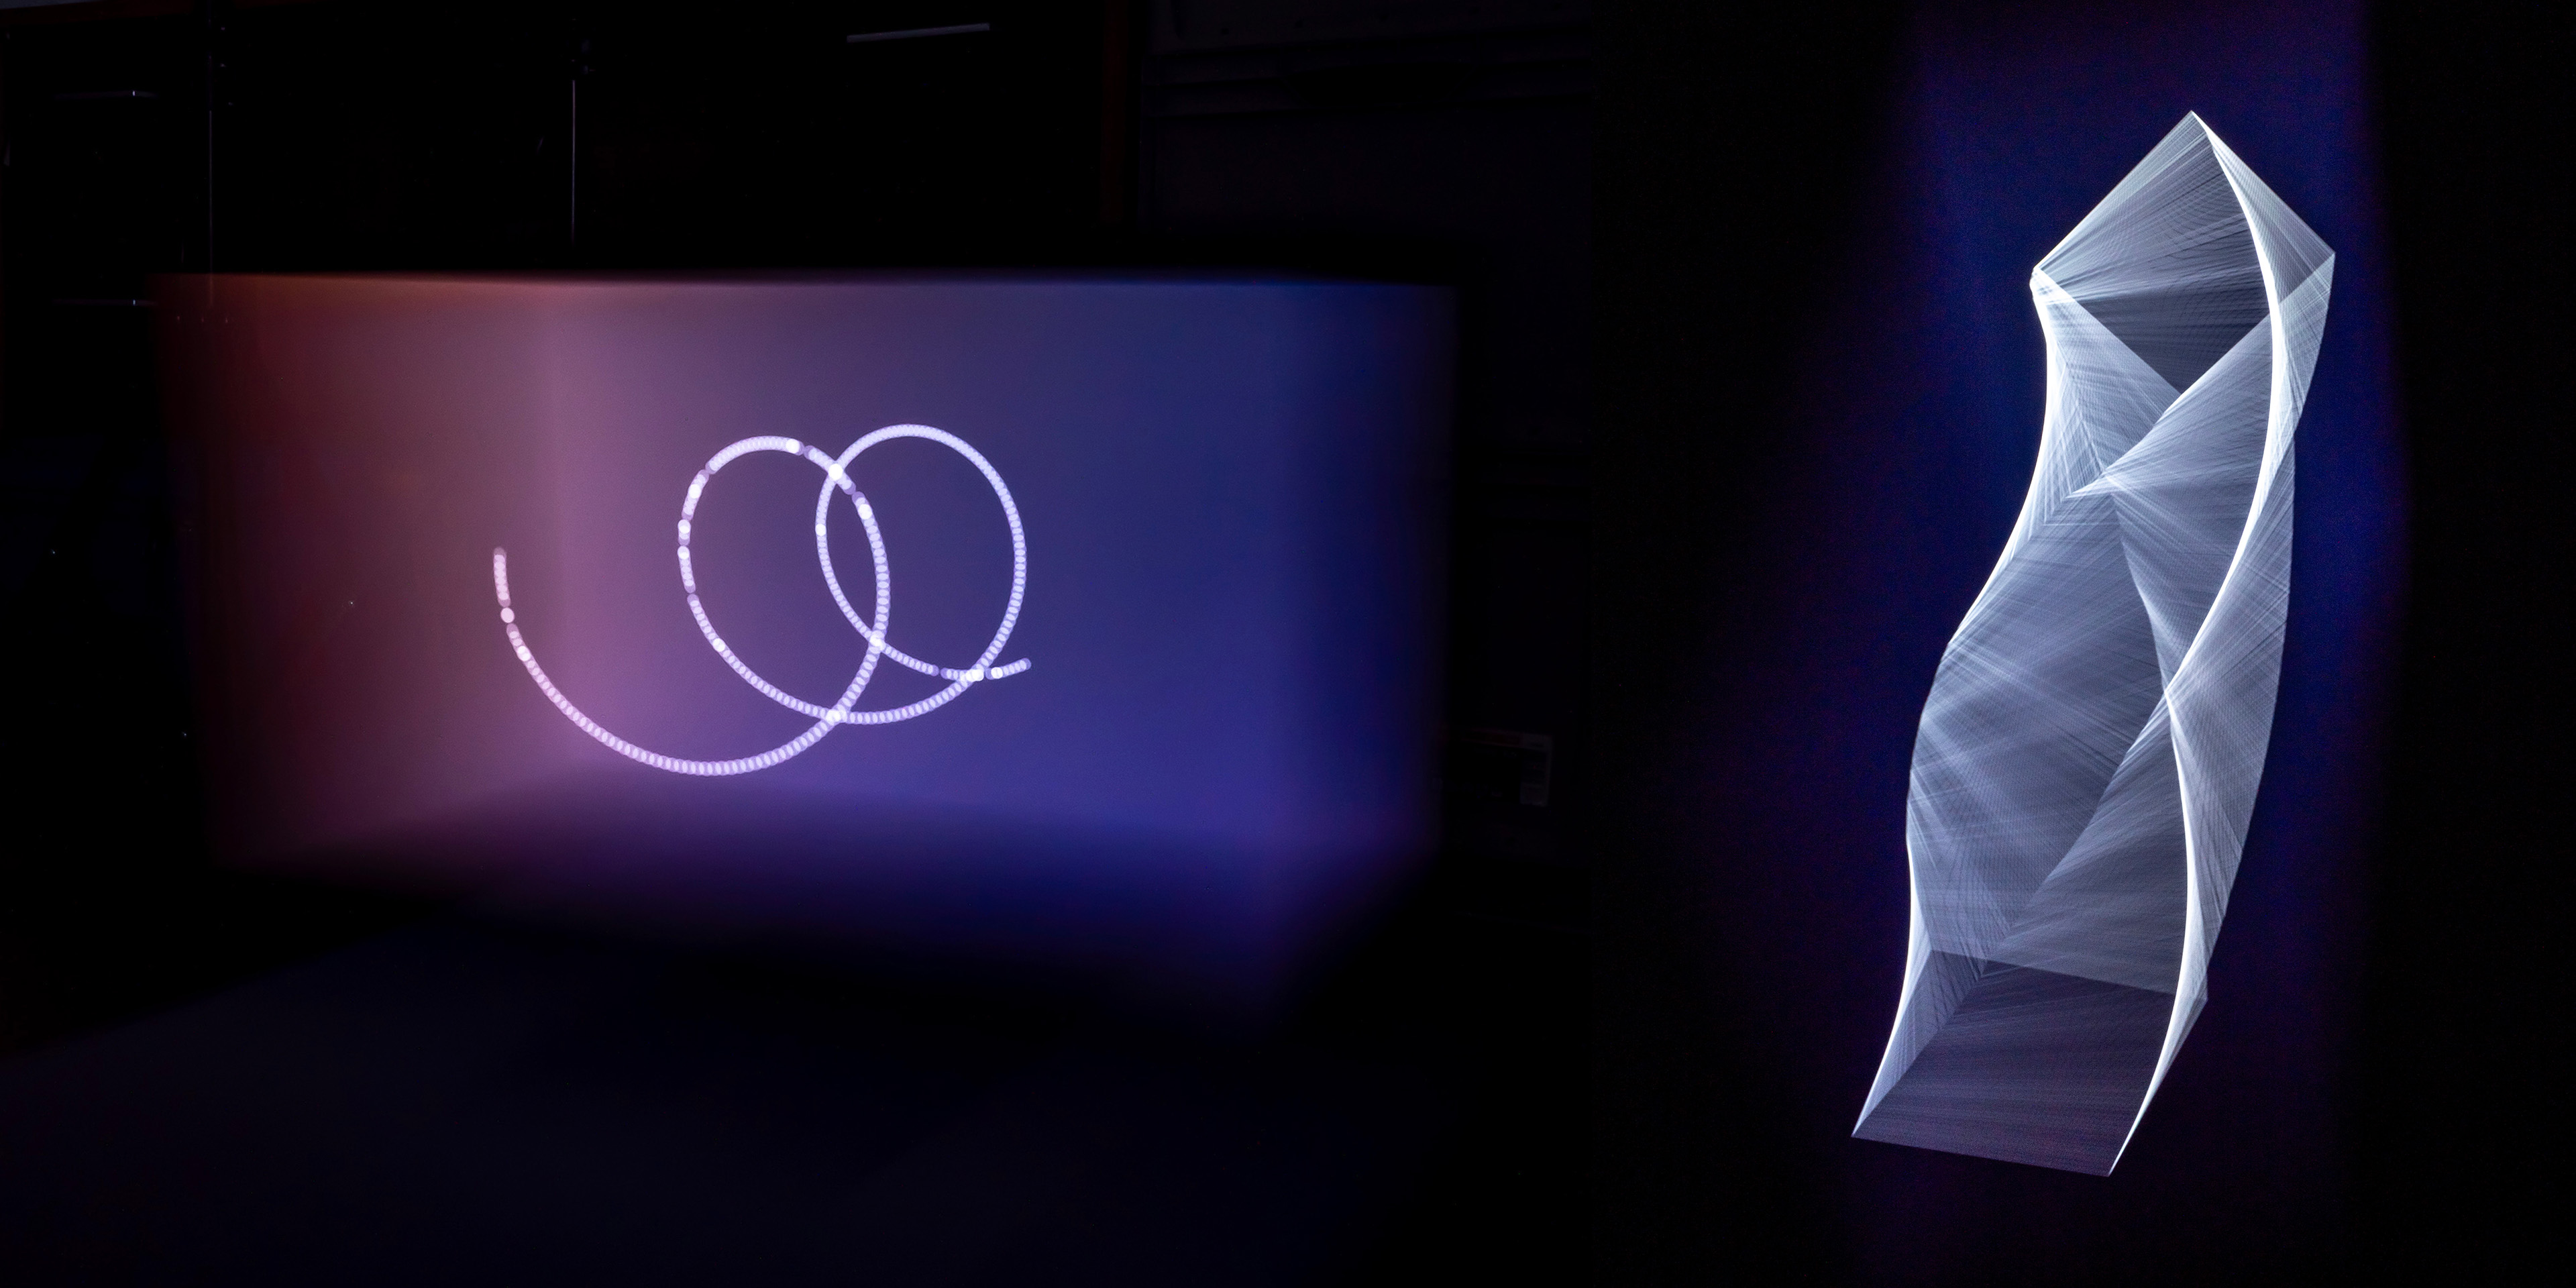
Even with pure black pixels as the background, the LCD backlight bled through, so the volumes appeared as ghostly cuboids. Depending on the viewing angle, the backlight bleeding shifted in color. At shallow angles, the bleed shifted toward blue or red, which tinted the volumes in-camera. Frame drops also became visible, with lag and refresh rates appearing as thin, darker striations and gaps, similar to growth rings or cuts through the structure.
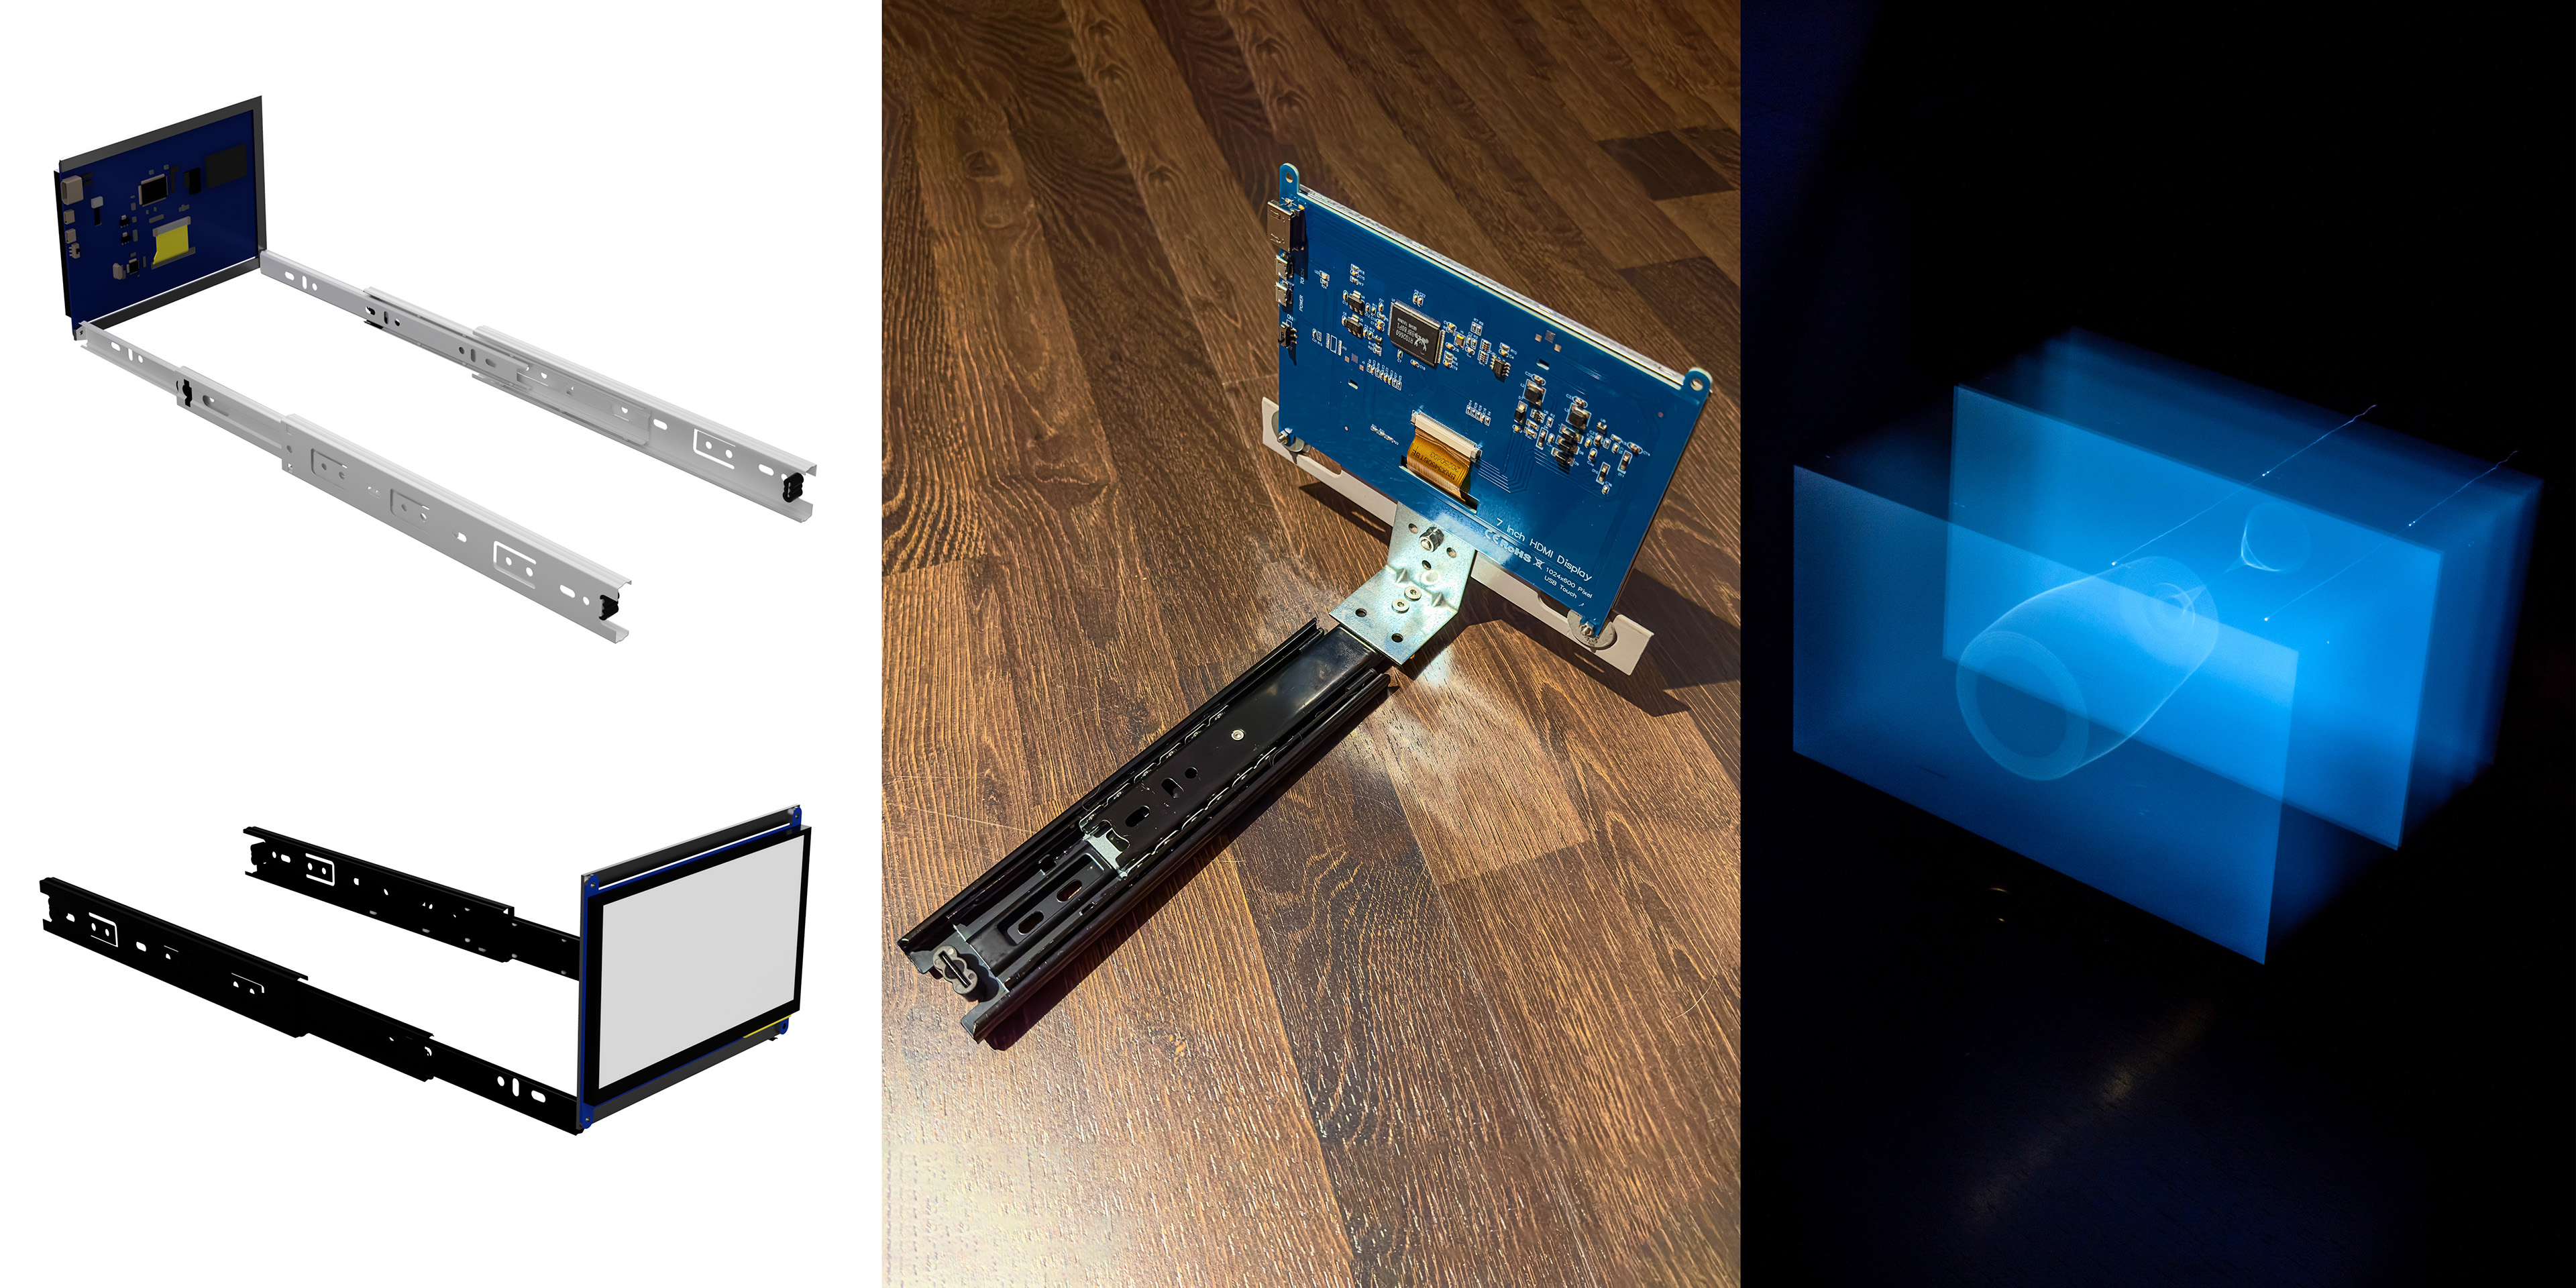
To gain more control, I mounted a Raspberry Pi display on ball-bearing sliders and manually drove it along a single axis.
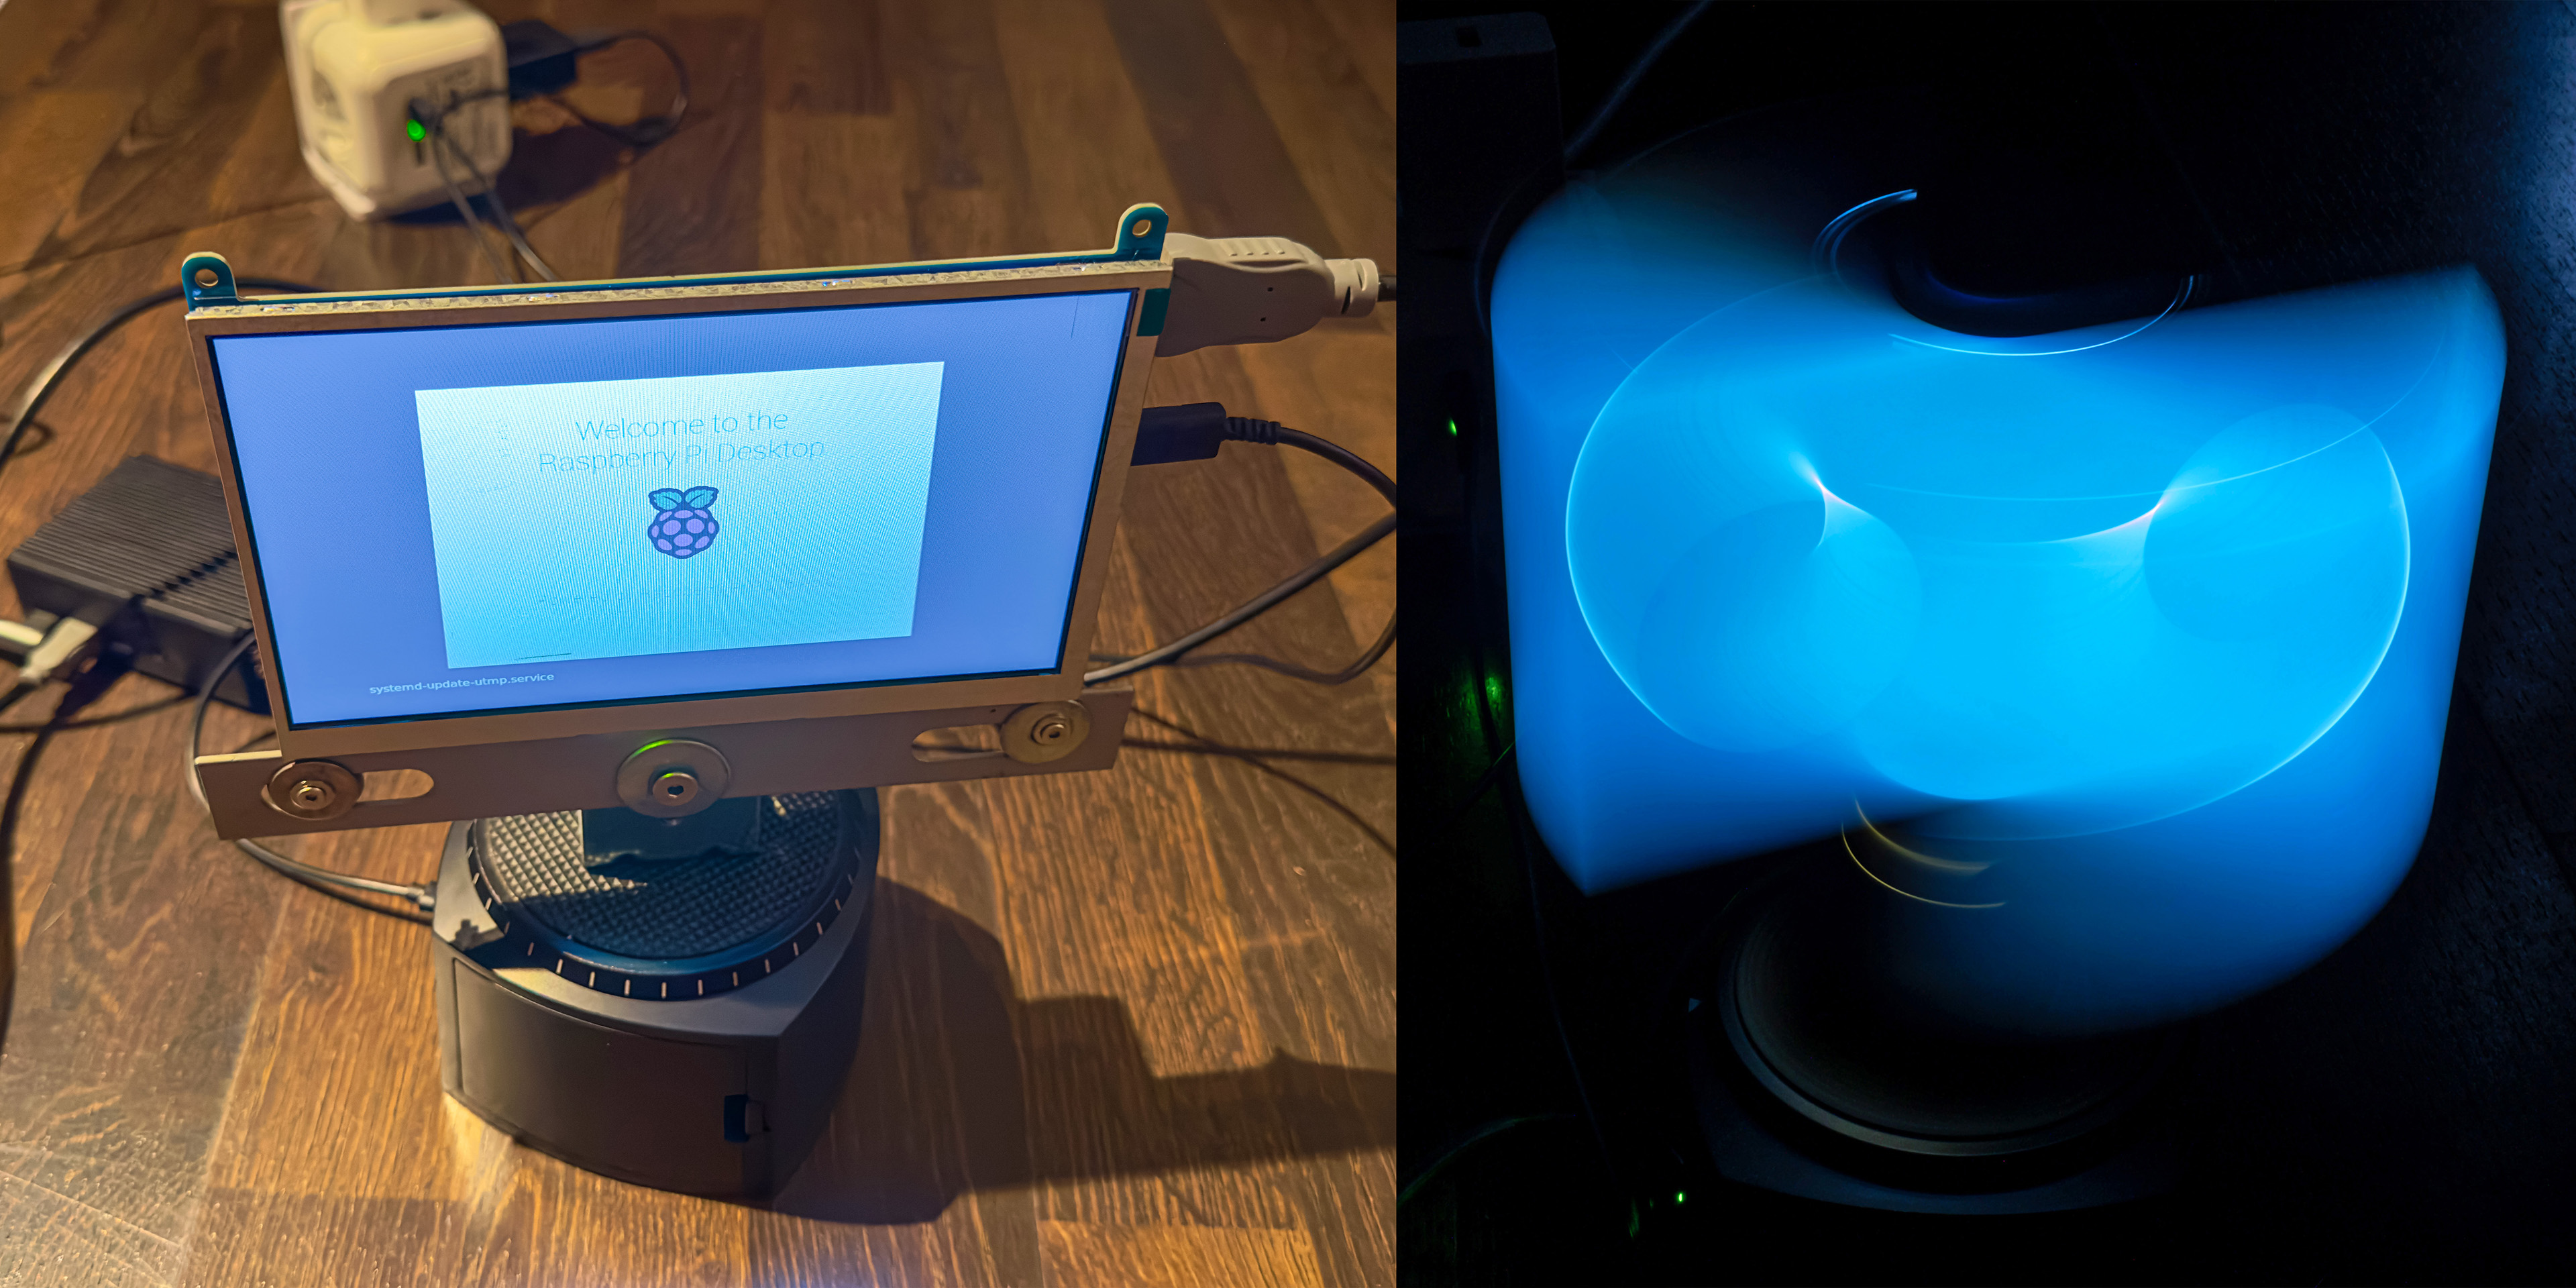
I also built a crude rotational rig: a turntable rotating a monitor around its center axis. Sweeping the same sketches generated cylindrical volumes and toroidal forms.
Turning image sequences into 3D shapes reminded me of medical imaging techniques such as CT or MRI scans, which represent objects as layered slices. I downloaded datasets of brain scans, satellites, fruits, and animals to “materialize” with my setup. By strapping the monitor to a linear actuator and carefully synchronizing travel speed, frame count, and exposure time, semi-transparent 3D objects emerged in-camera from the two-dimensional scan videos. Depending on where I placed the camera, I got a different angle of the same 3D object.
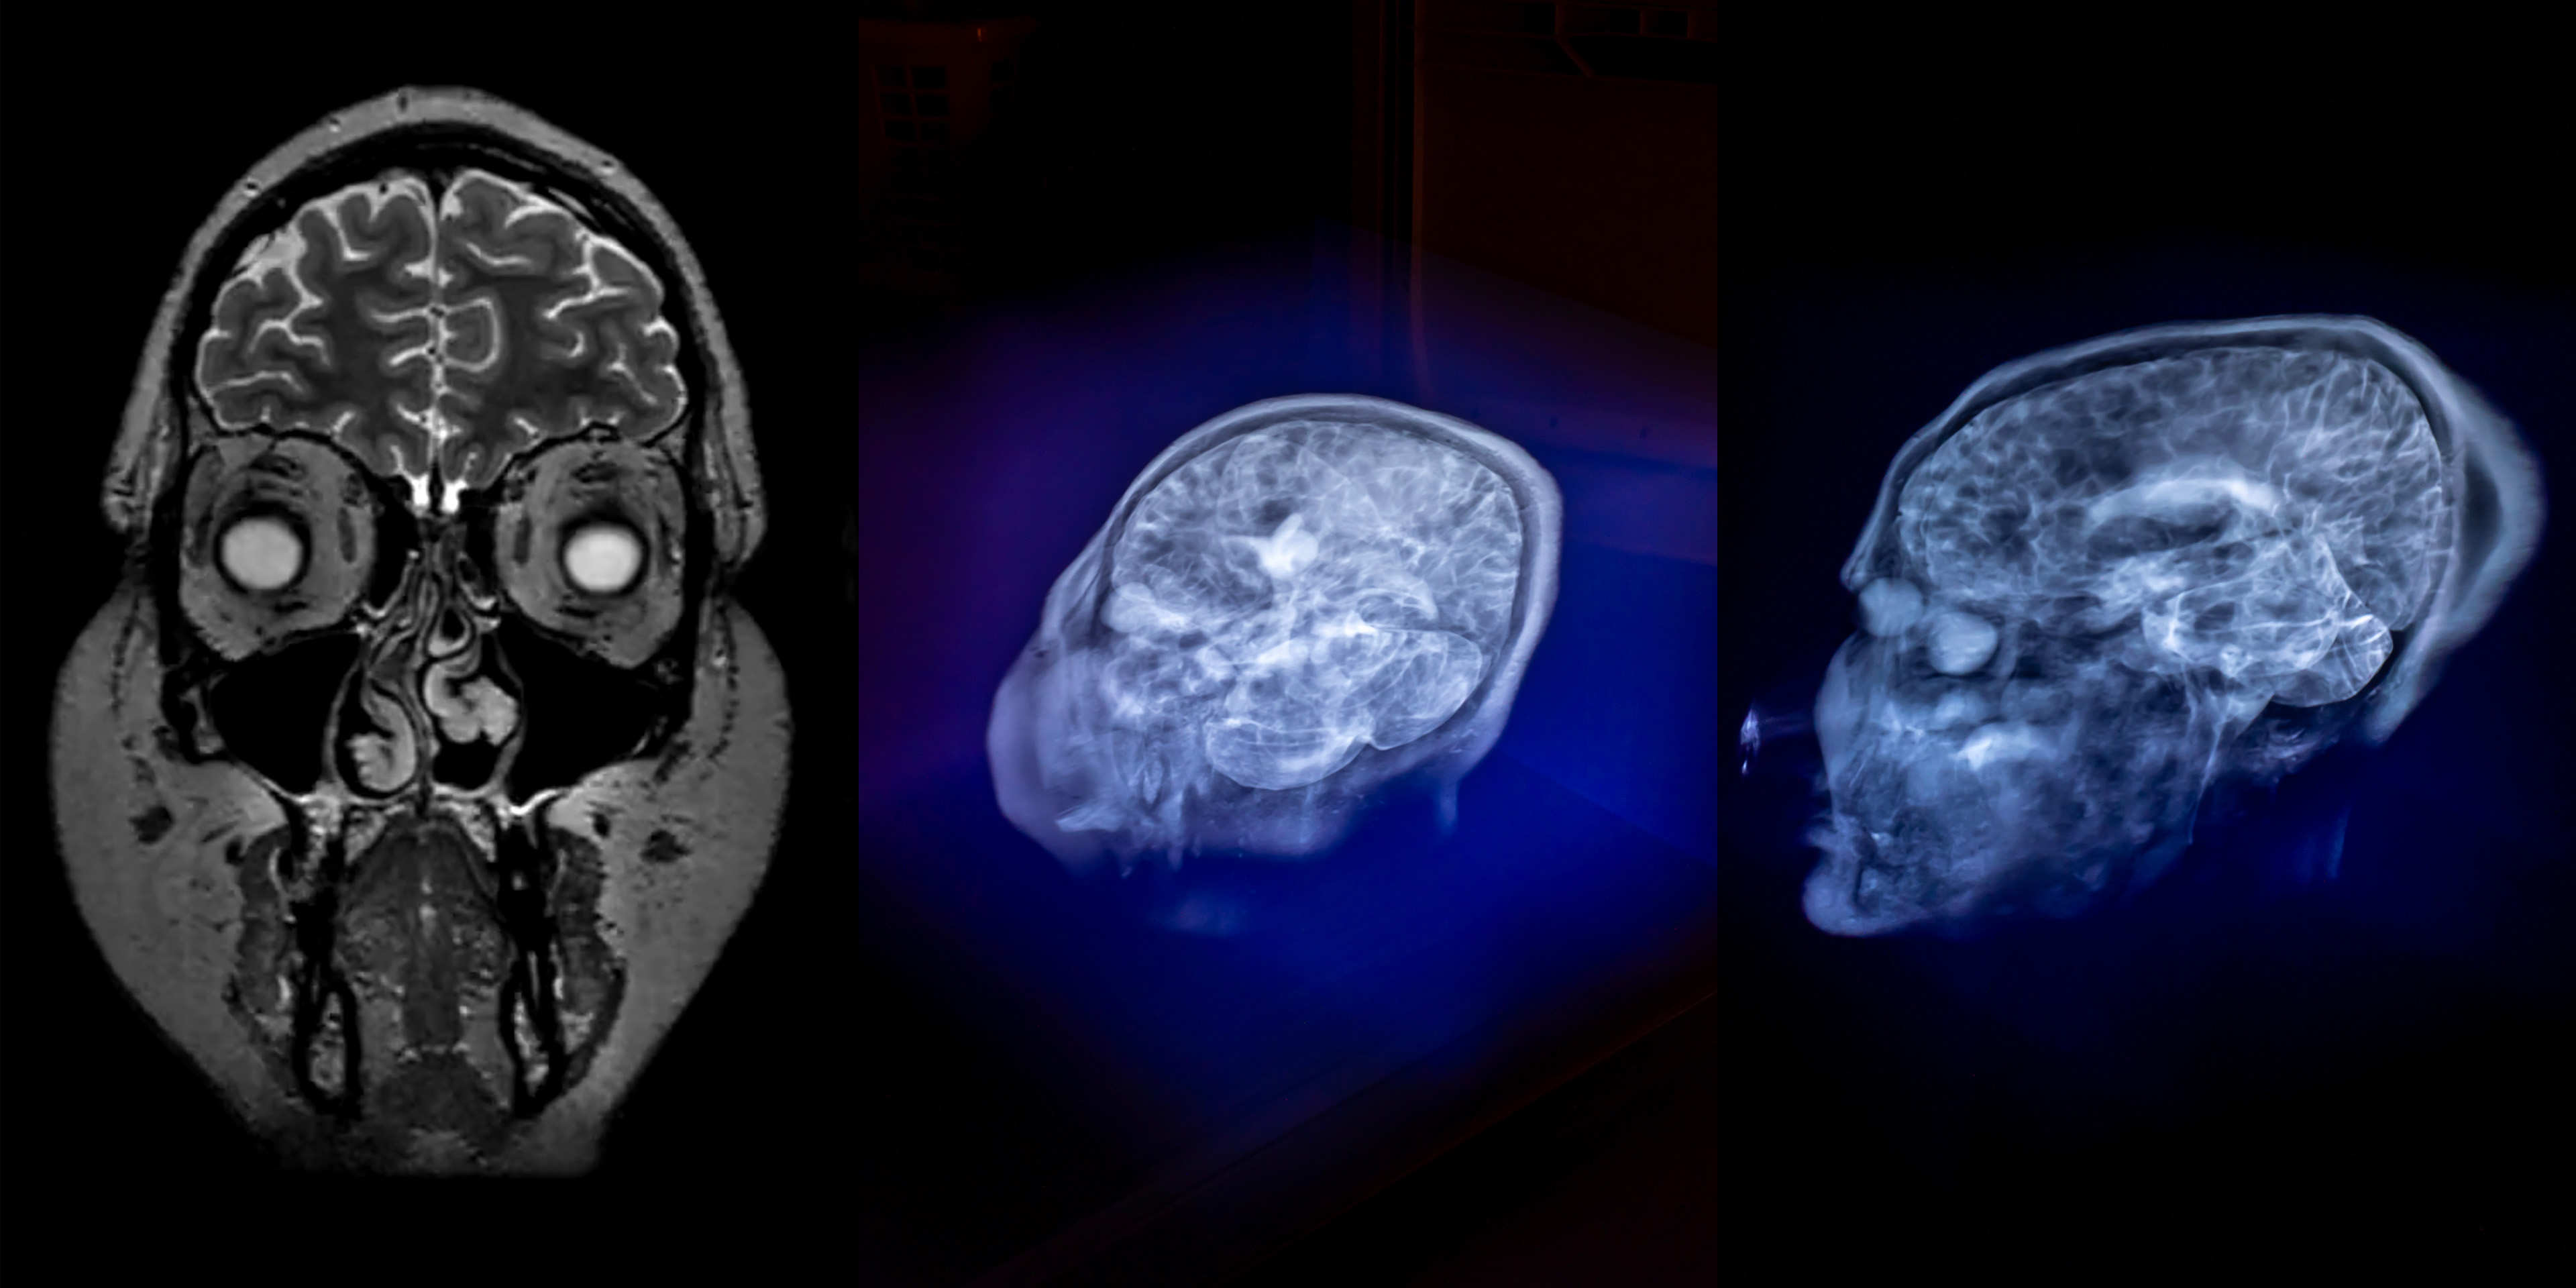
These experiments established the principle, but the improvised rigs made speed, alignment, and repeated movement difficult to control. This led to the larger, automated monitor lift used in the final installation.
Monitor Lift
After some research on how to build scissor lifts, I decided that it would be cheaper and more reliable to buy one and modify it to my needs than to build one from scratch. I found a relatively inexpensive, sturdy hydraulic motorcycle scissor jack with a double-scissor mechanism. To replace the hydraulic pump, I first got a linear actuator that fit perfectly within the already existing mounting holes. It had a 150 N rating, which was higher than the approximately 100 N I had estimated, and it was the only one I could find that could retract to that size while also having a 100 mm stroke. However, when I installed it, it could barely lift the platform, drew over 10 A, and got hot and didn’t feel reliable enough for longer use.
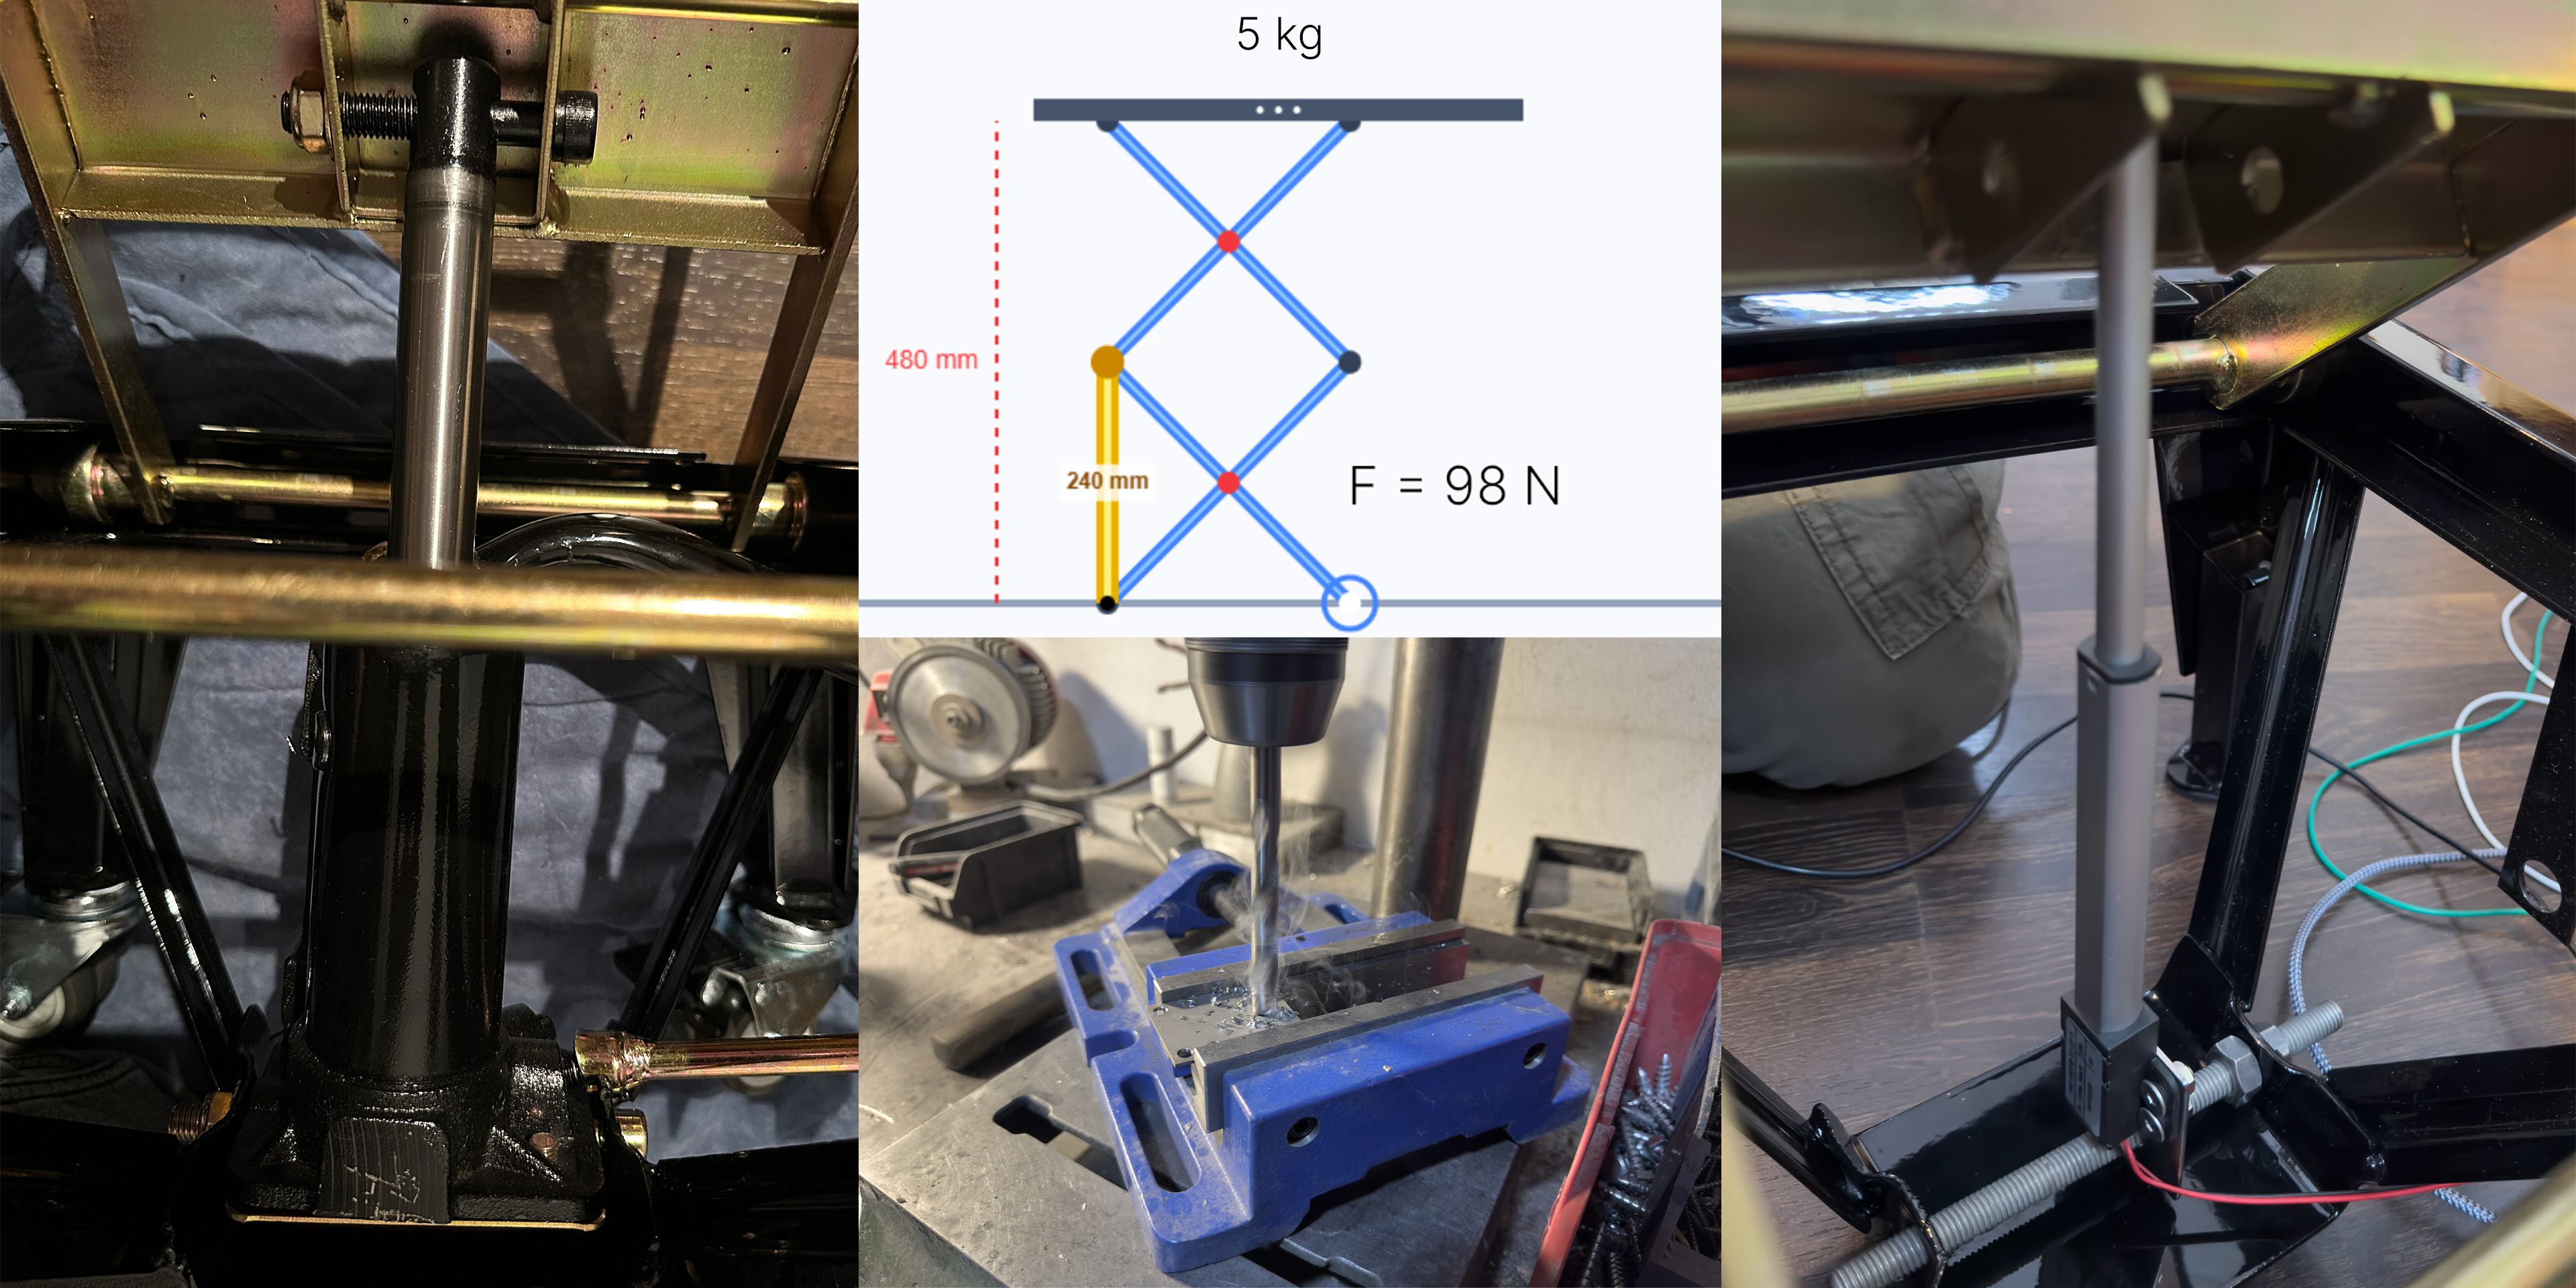
I therefore replaced it with a stronger 100 mm linear actuator rated for 1500 N. However, because it had a longer minimum retracted length, it no longer fit into the existing mounting holes. This meant I had to cut an opening into the bottom frame of the lift and make two extension brackets. I used plastic washers to keep the actuator centered and wrapped tape around the screw to reduce vibration noise and prevent it from being amplified by the scissor mechanism.
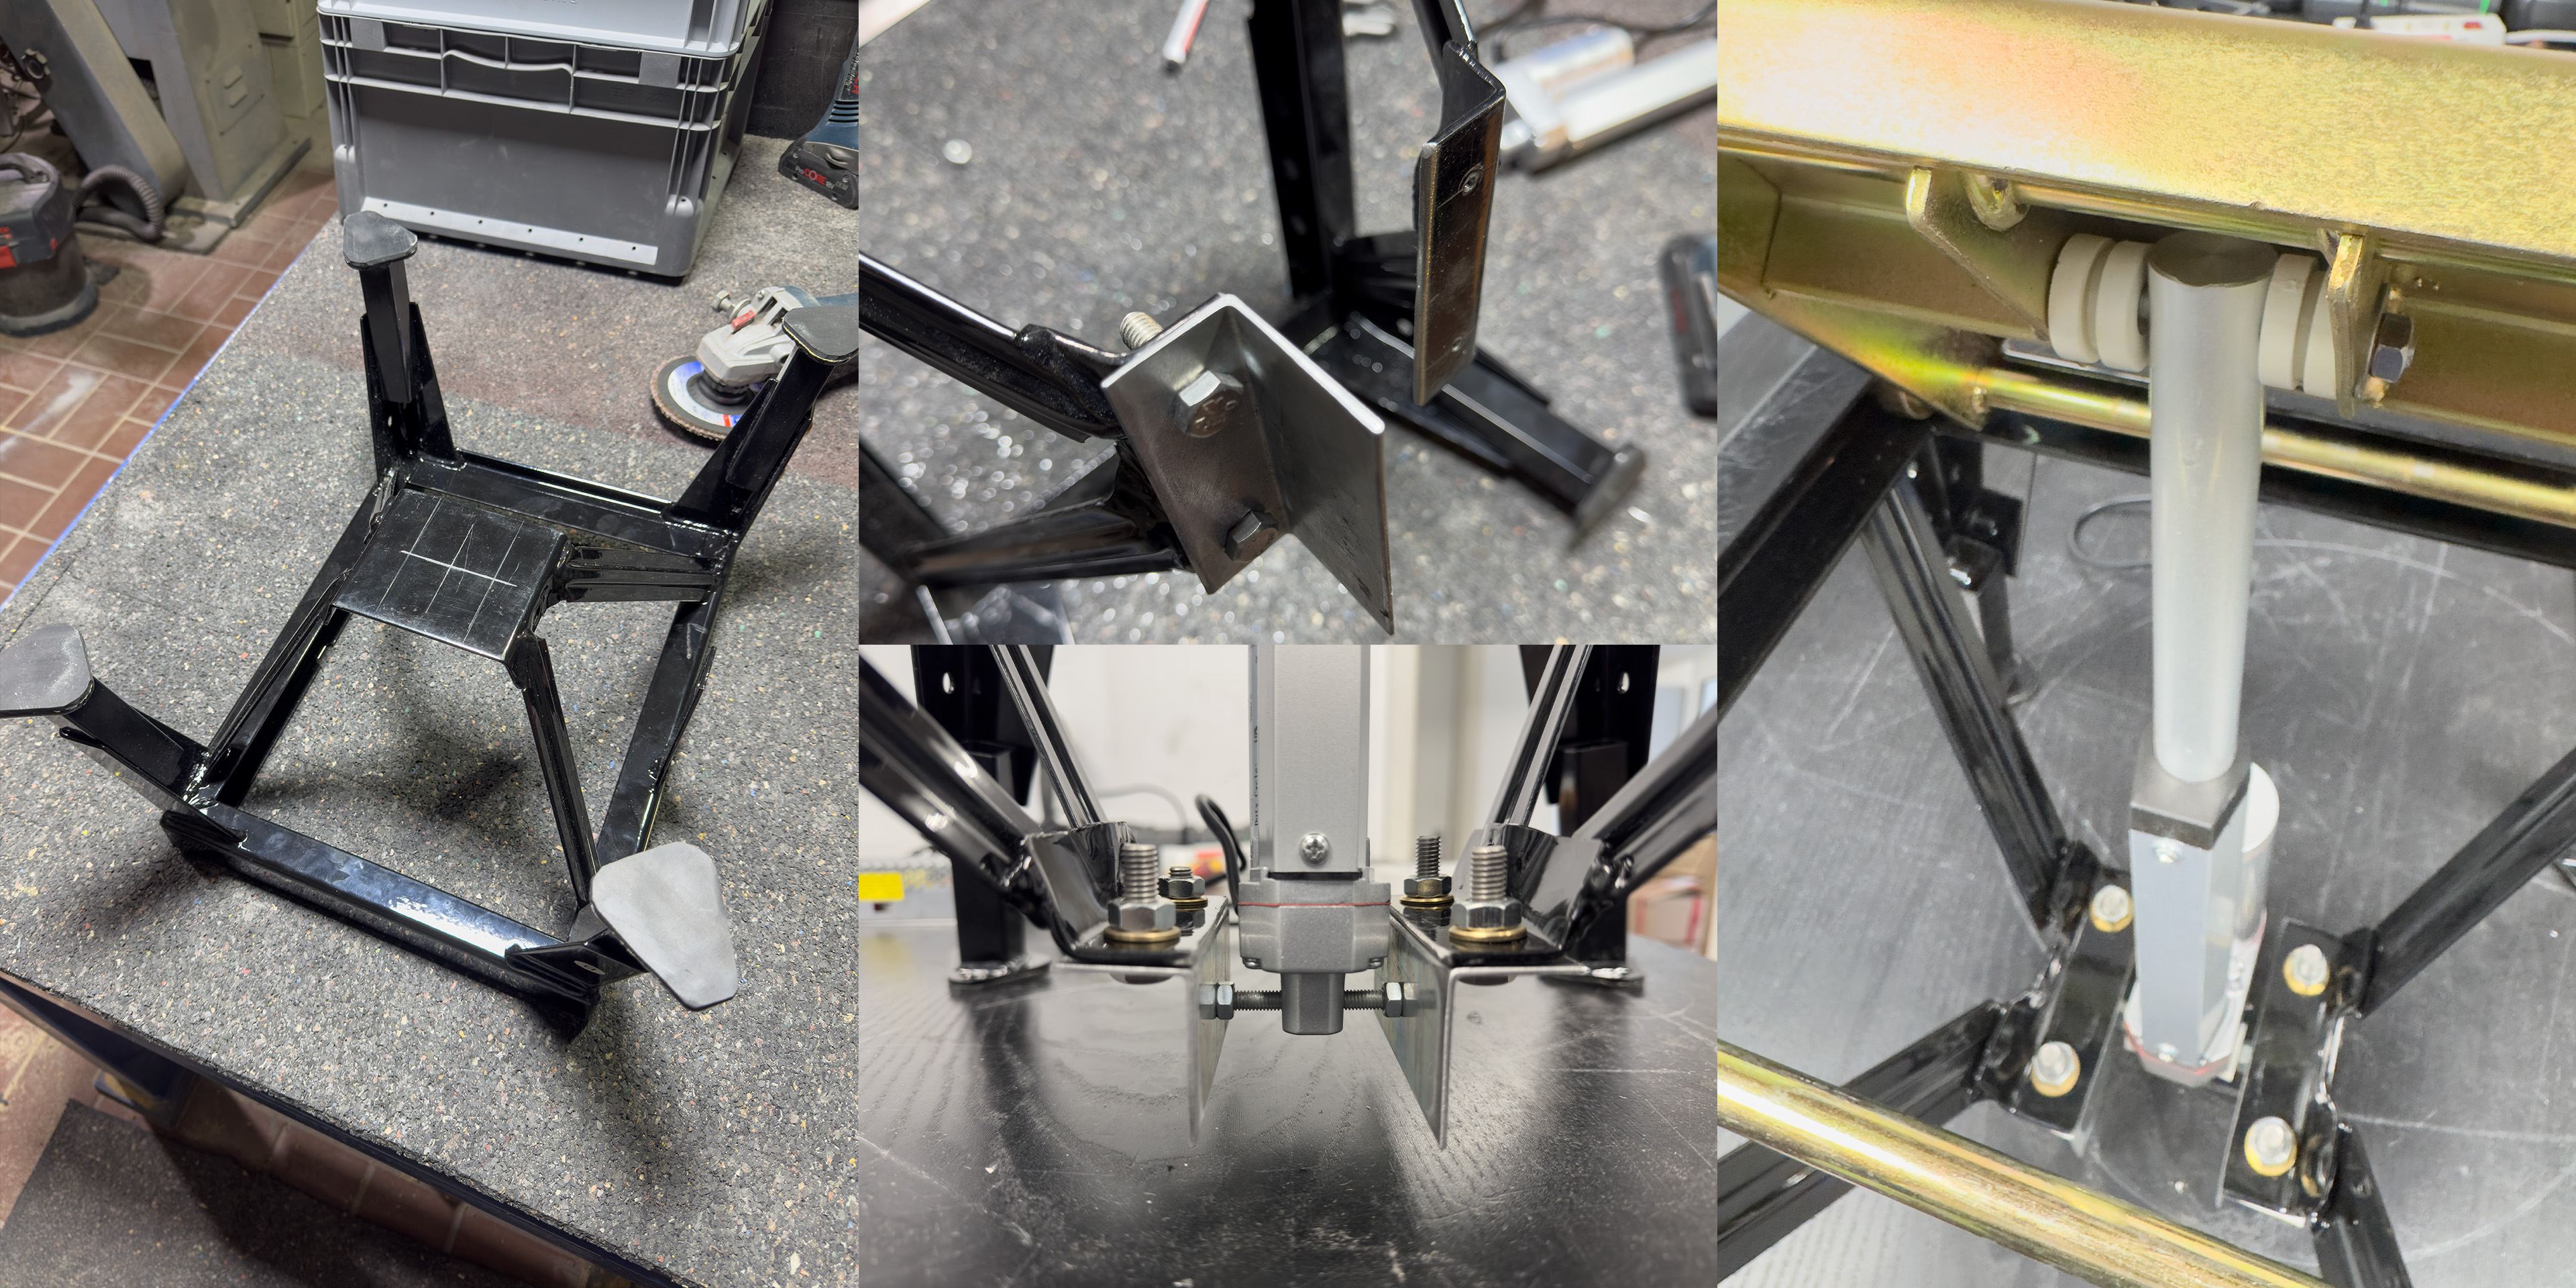
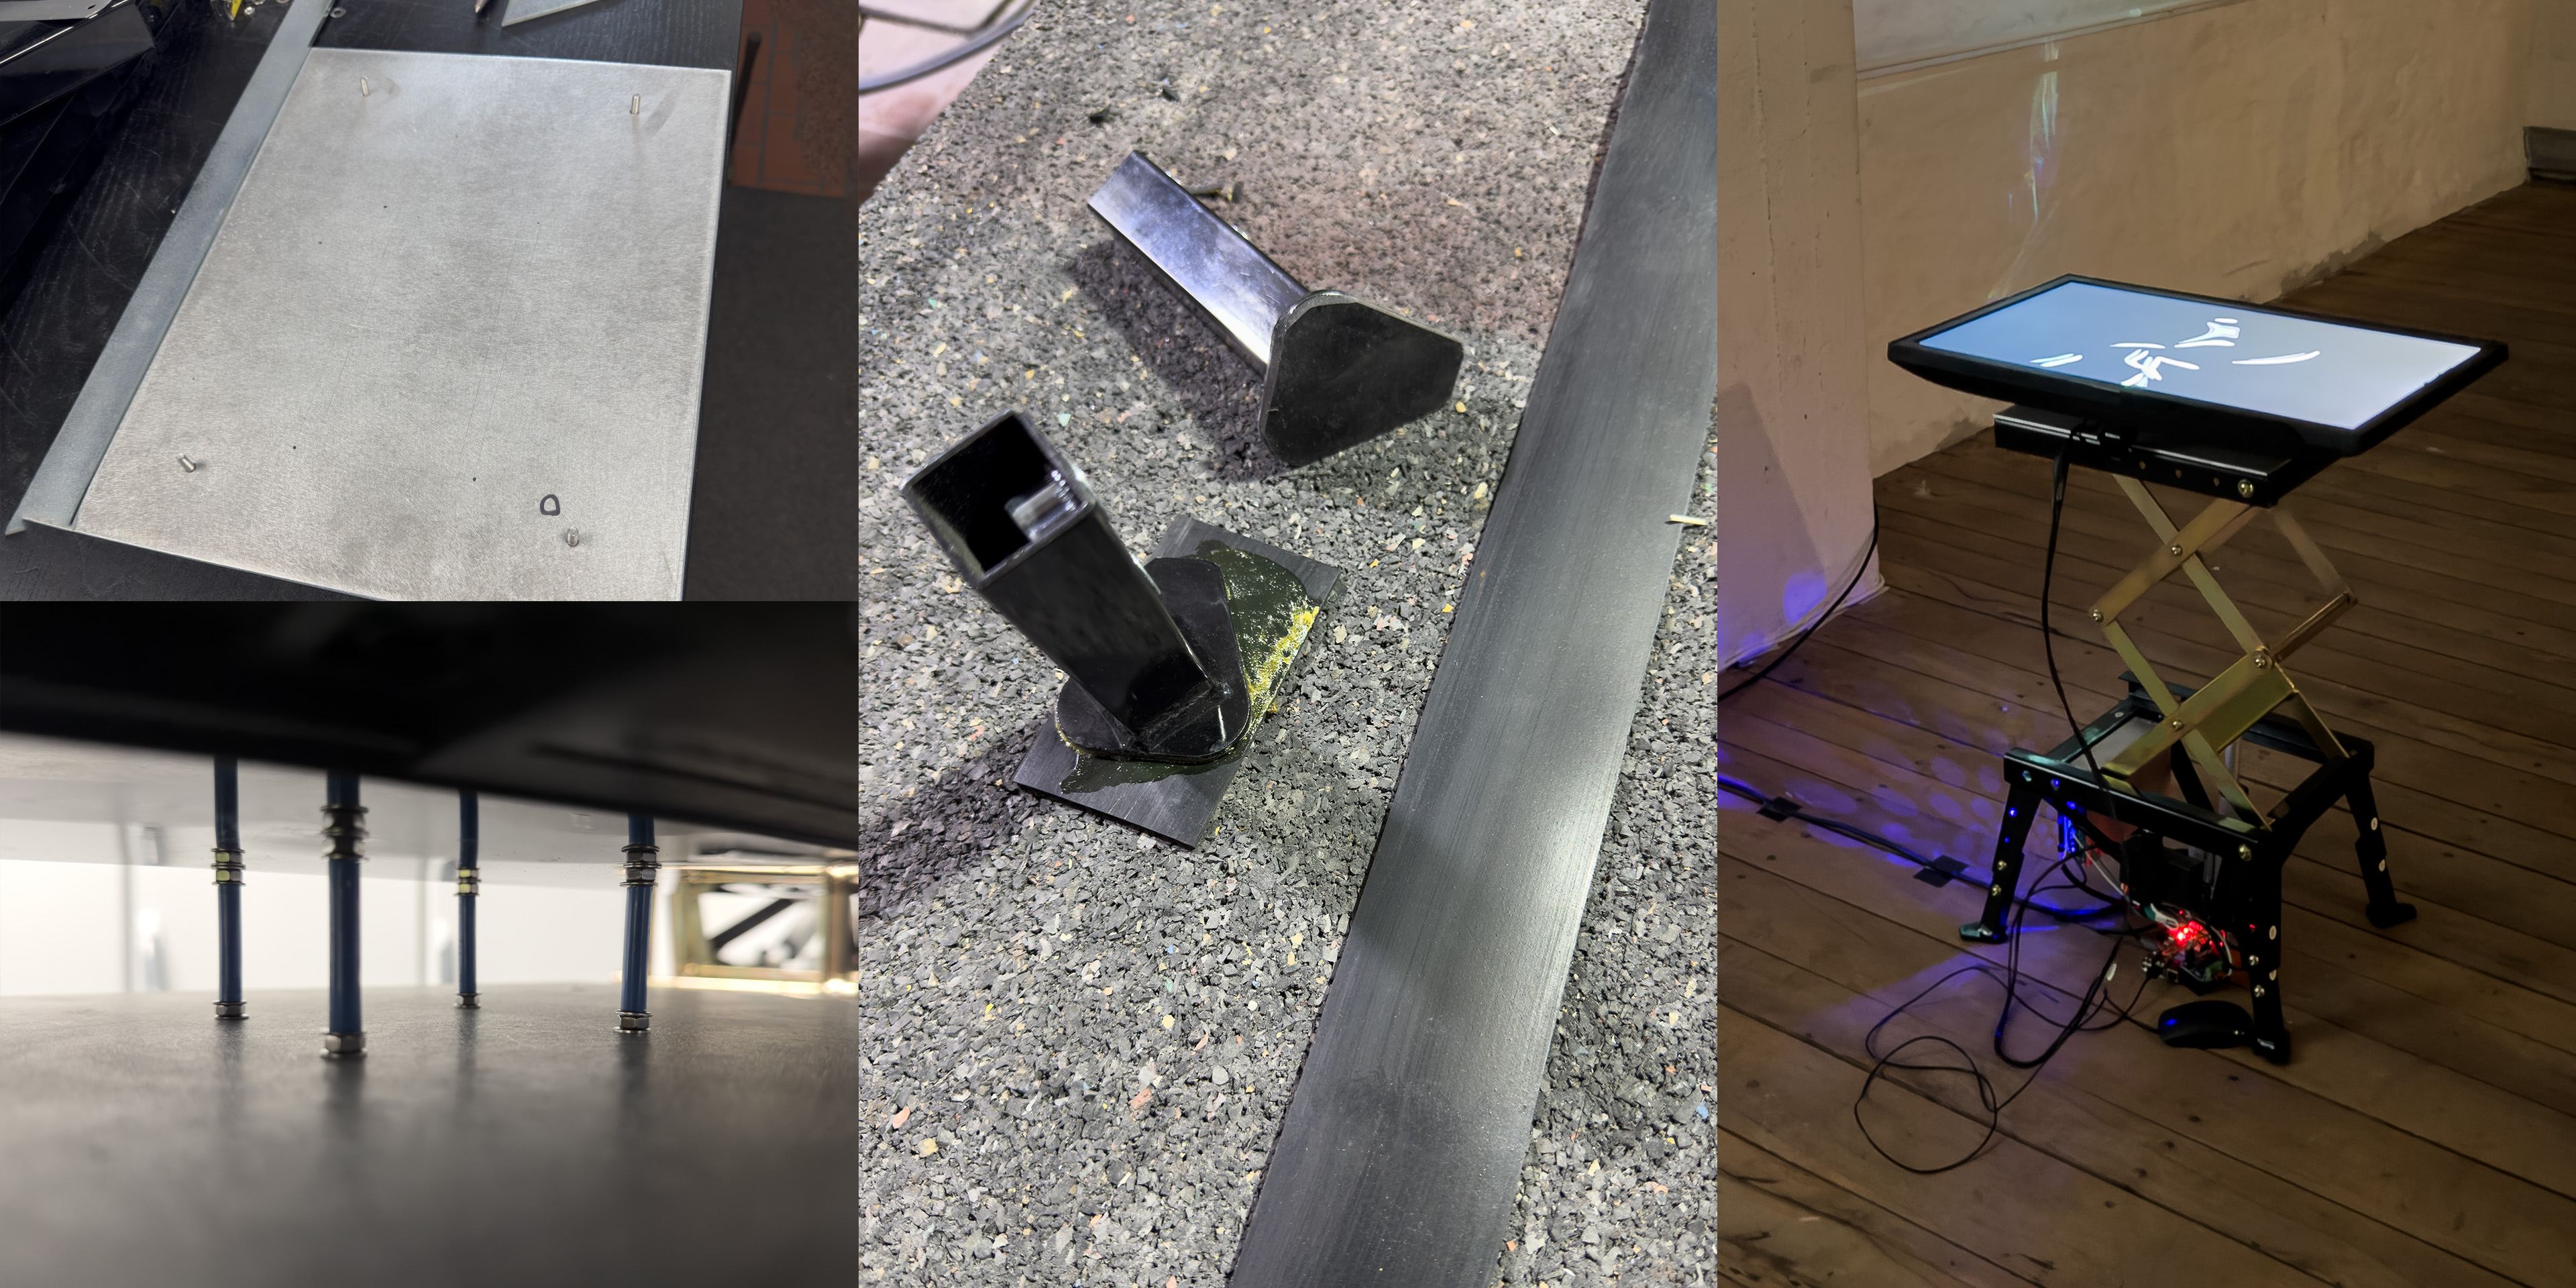
The new actuator worked much better, and I connected it to my Raspberry Pi 4 through an H-bridge motor driver with PWM control and ran some tests. I wanted to use the Raspberry Pi, so the same system could control the actuator movement and visual output. For the display, I first used the old LCD monitor I used for my previous experiments. I used an aluminum plate that I attached to the top of the scissor lift, because it had a square hole to put the motorcycle wheel in the center. I used long screws and some plastic tubes and nuts as spacers between the monitor and the plate, to leave enough space for the cables on the back of the monitor. I removed the wheels from the legs and replaced them with flat rubber feet.
Electronics
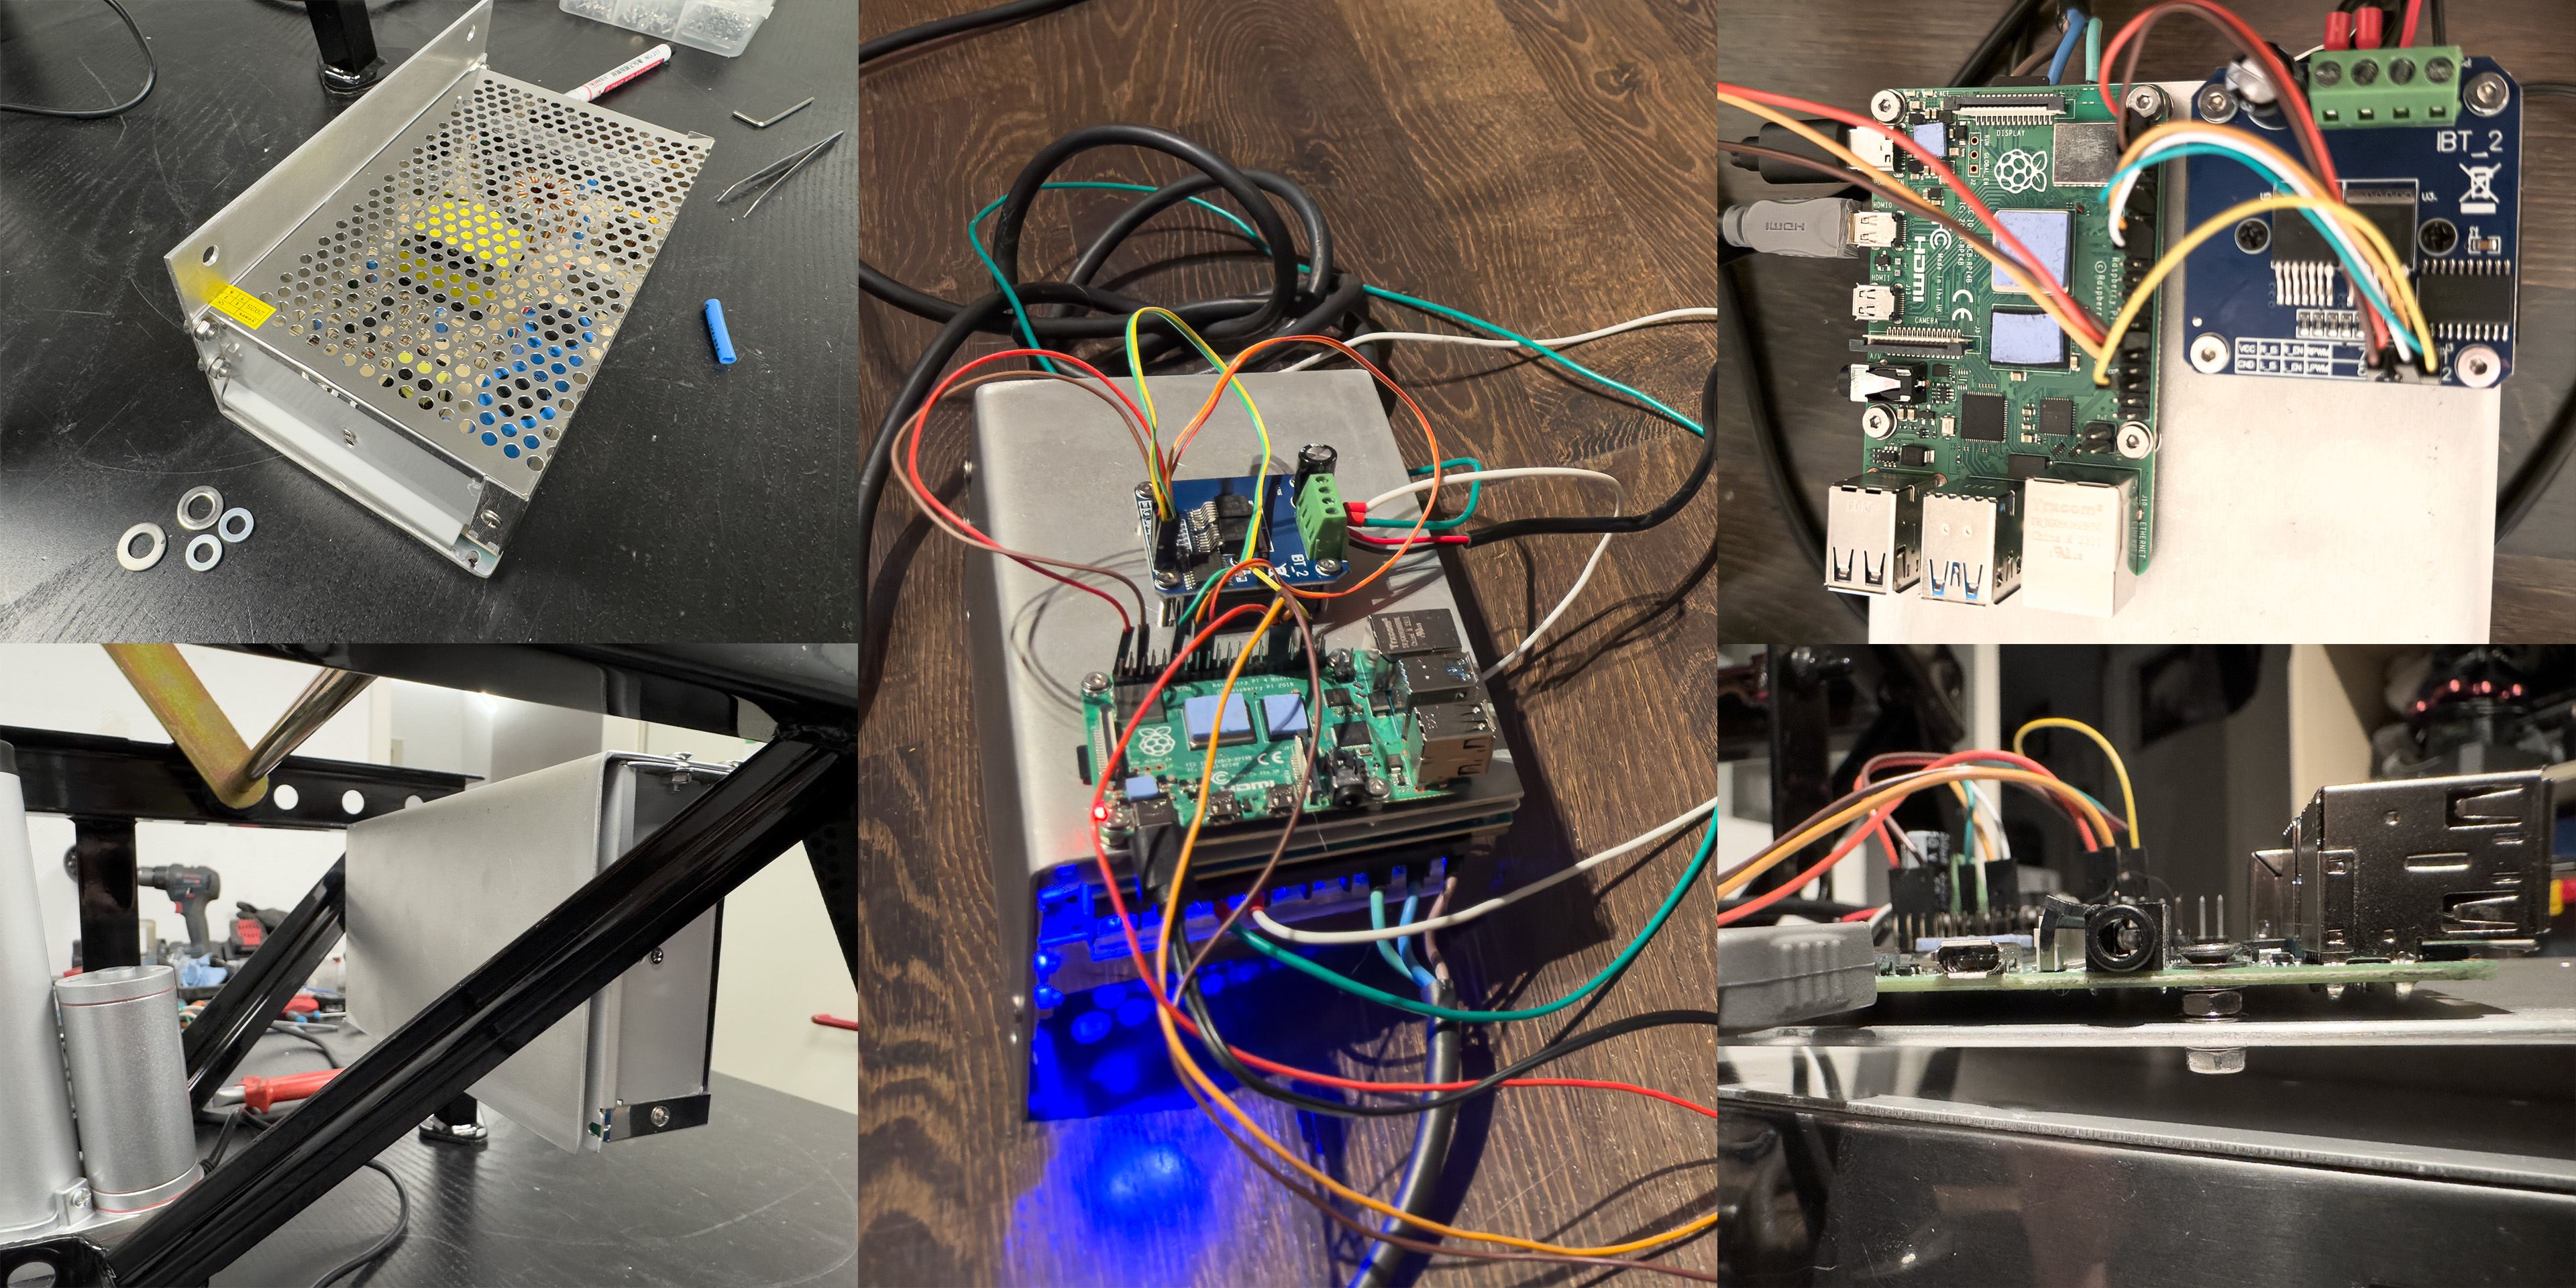
For the electronics, I used another aluminum sheet that I cut and bent to fit below the scissors. I printed out the 1:1 schematics and taped them on as a template for the holes. After drilling, I attached the Raspberry Pi, the motor driver, and the DC converter with nuts to ensure a sufficient clearance from the connectors on the board. Then I made custom wires to connect the pins.
Monitor and Lift Improvements
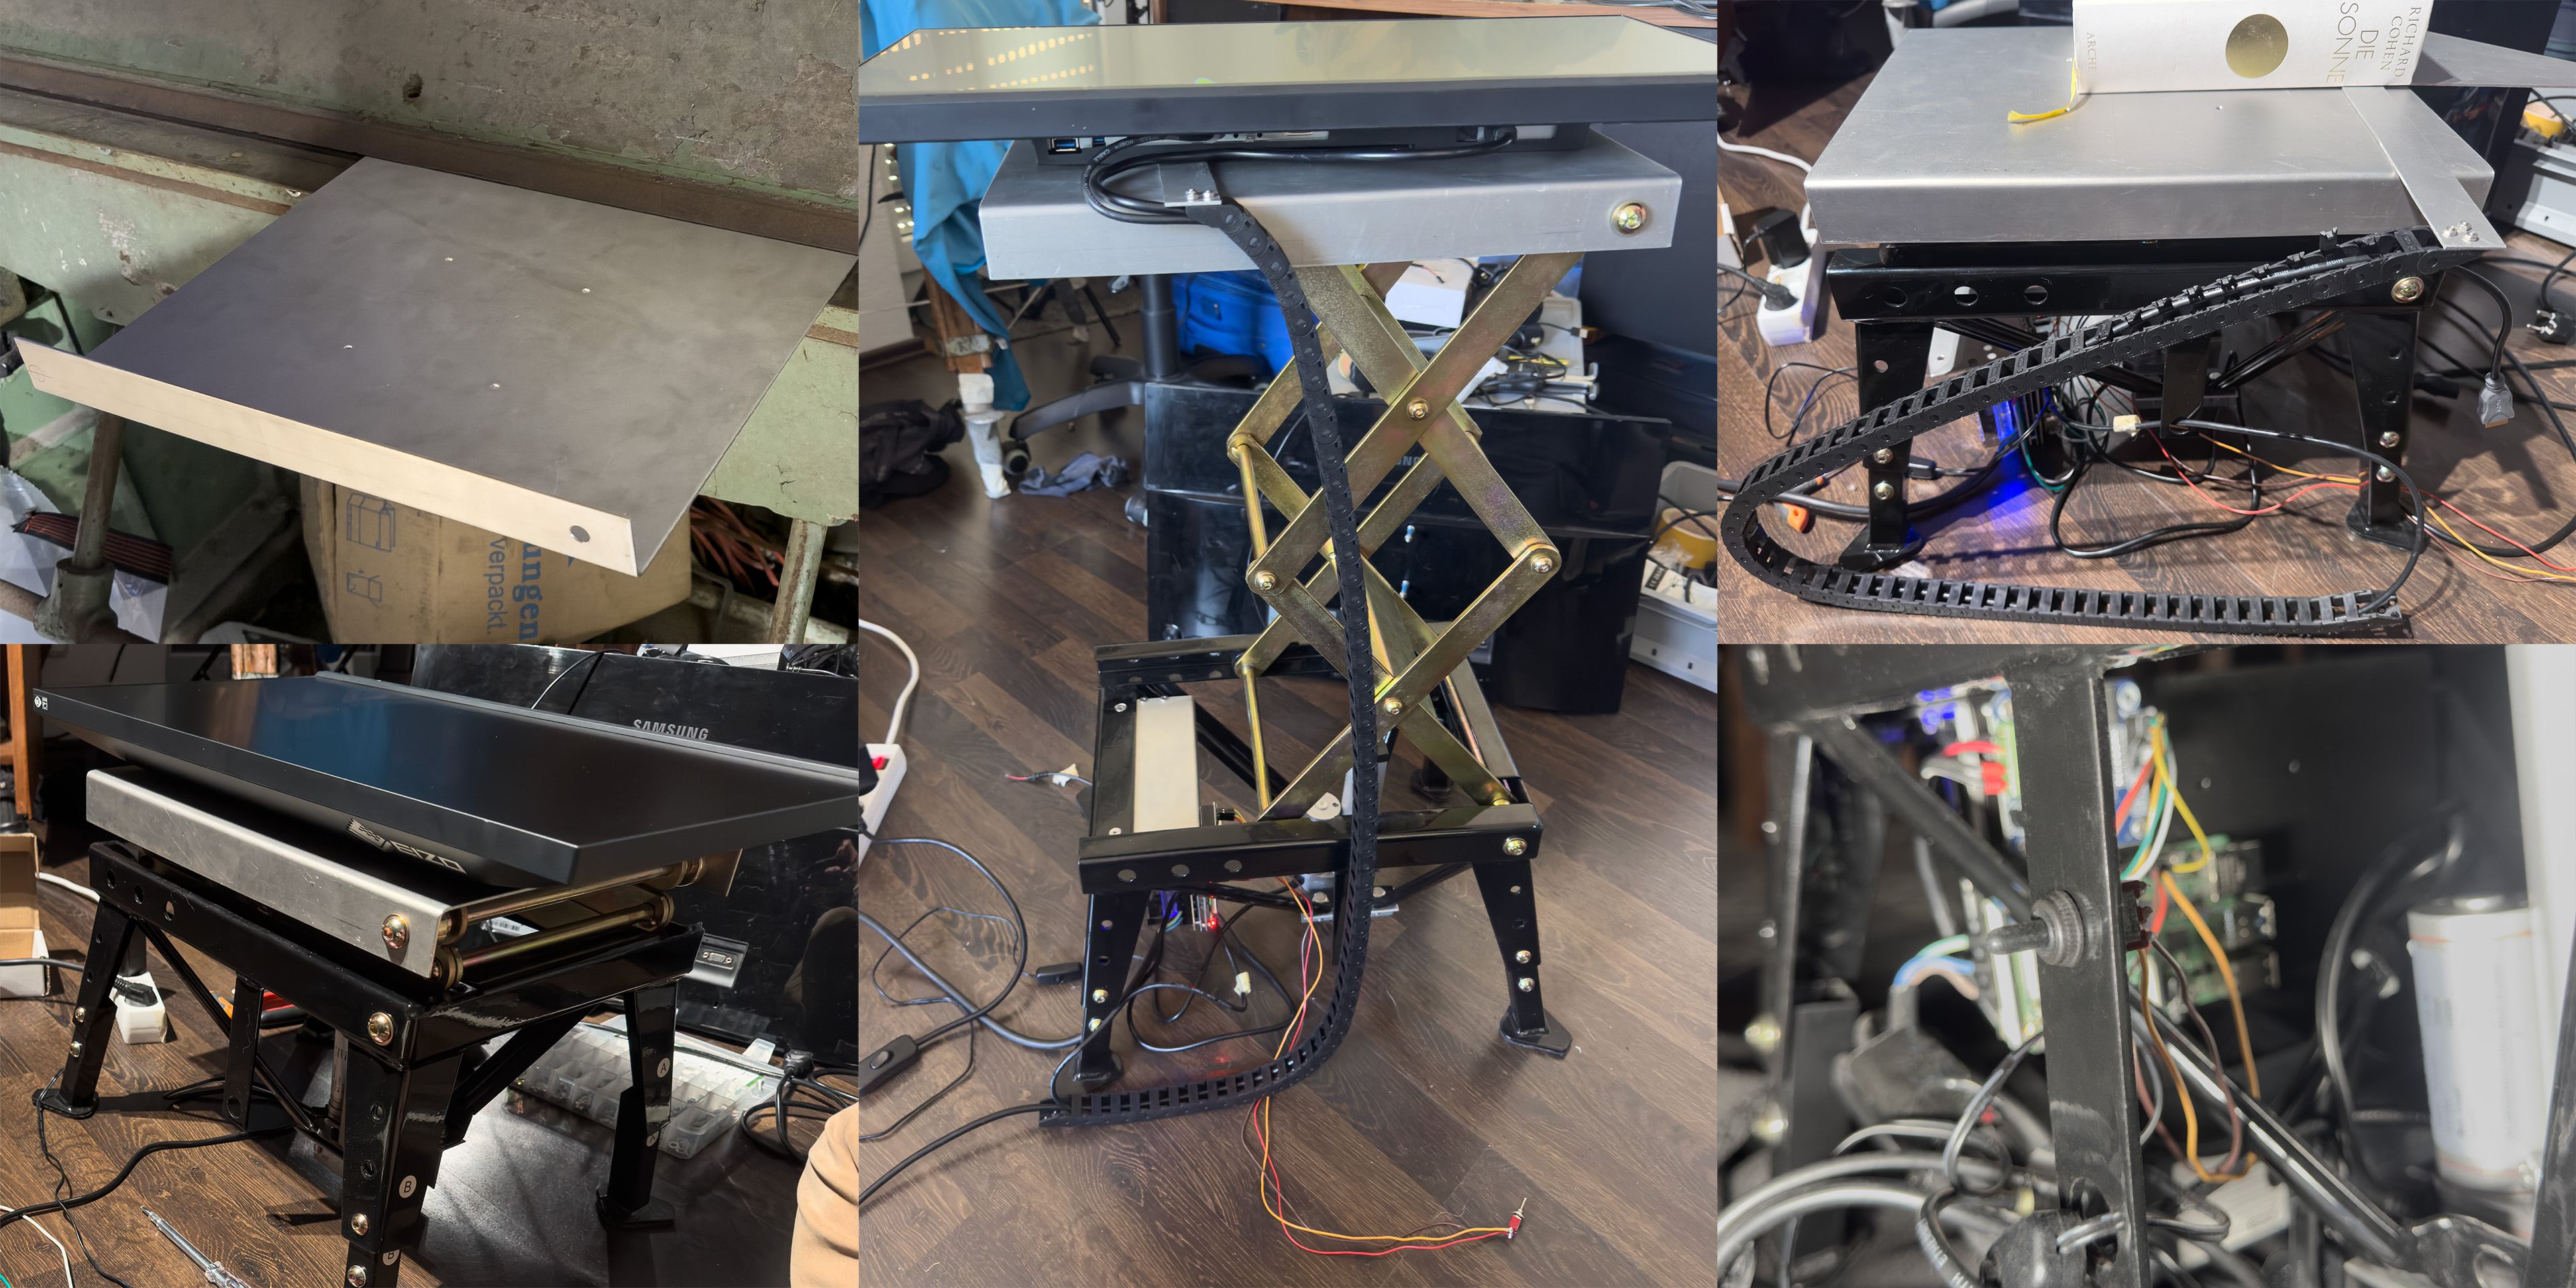
I replaced the old monitor with one that had a thinner bezel, no LED lights, and right-angled sockets, so it could lie flat on its back. To reduce weight, I decided to replace the heavy steel top part of the scissor lift with a custom-made aluminum part. I laser-engraved the drill-hole marks for the new monitor, the attachment holes for the lift, and the bent lines. Then I bent the part with a manual sheet metal folder. I bent it only once on each side, so the attachment point can act like a hinge, which makes attaching and taking off the monitor easier. I also attached a cable drag chain to the top plate to guide the monitor’s power and HDMI cables and prevent them from entering the scissor mechanism.
The original lift had a part attached that was meant to guide a handle to open the release valve. I shortened it with an angle grinder and drilled a hole to attach a spring toggle button, which allows me to move the lift manually.
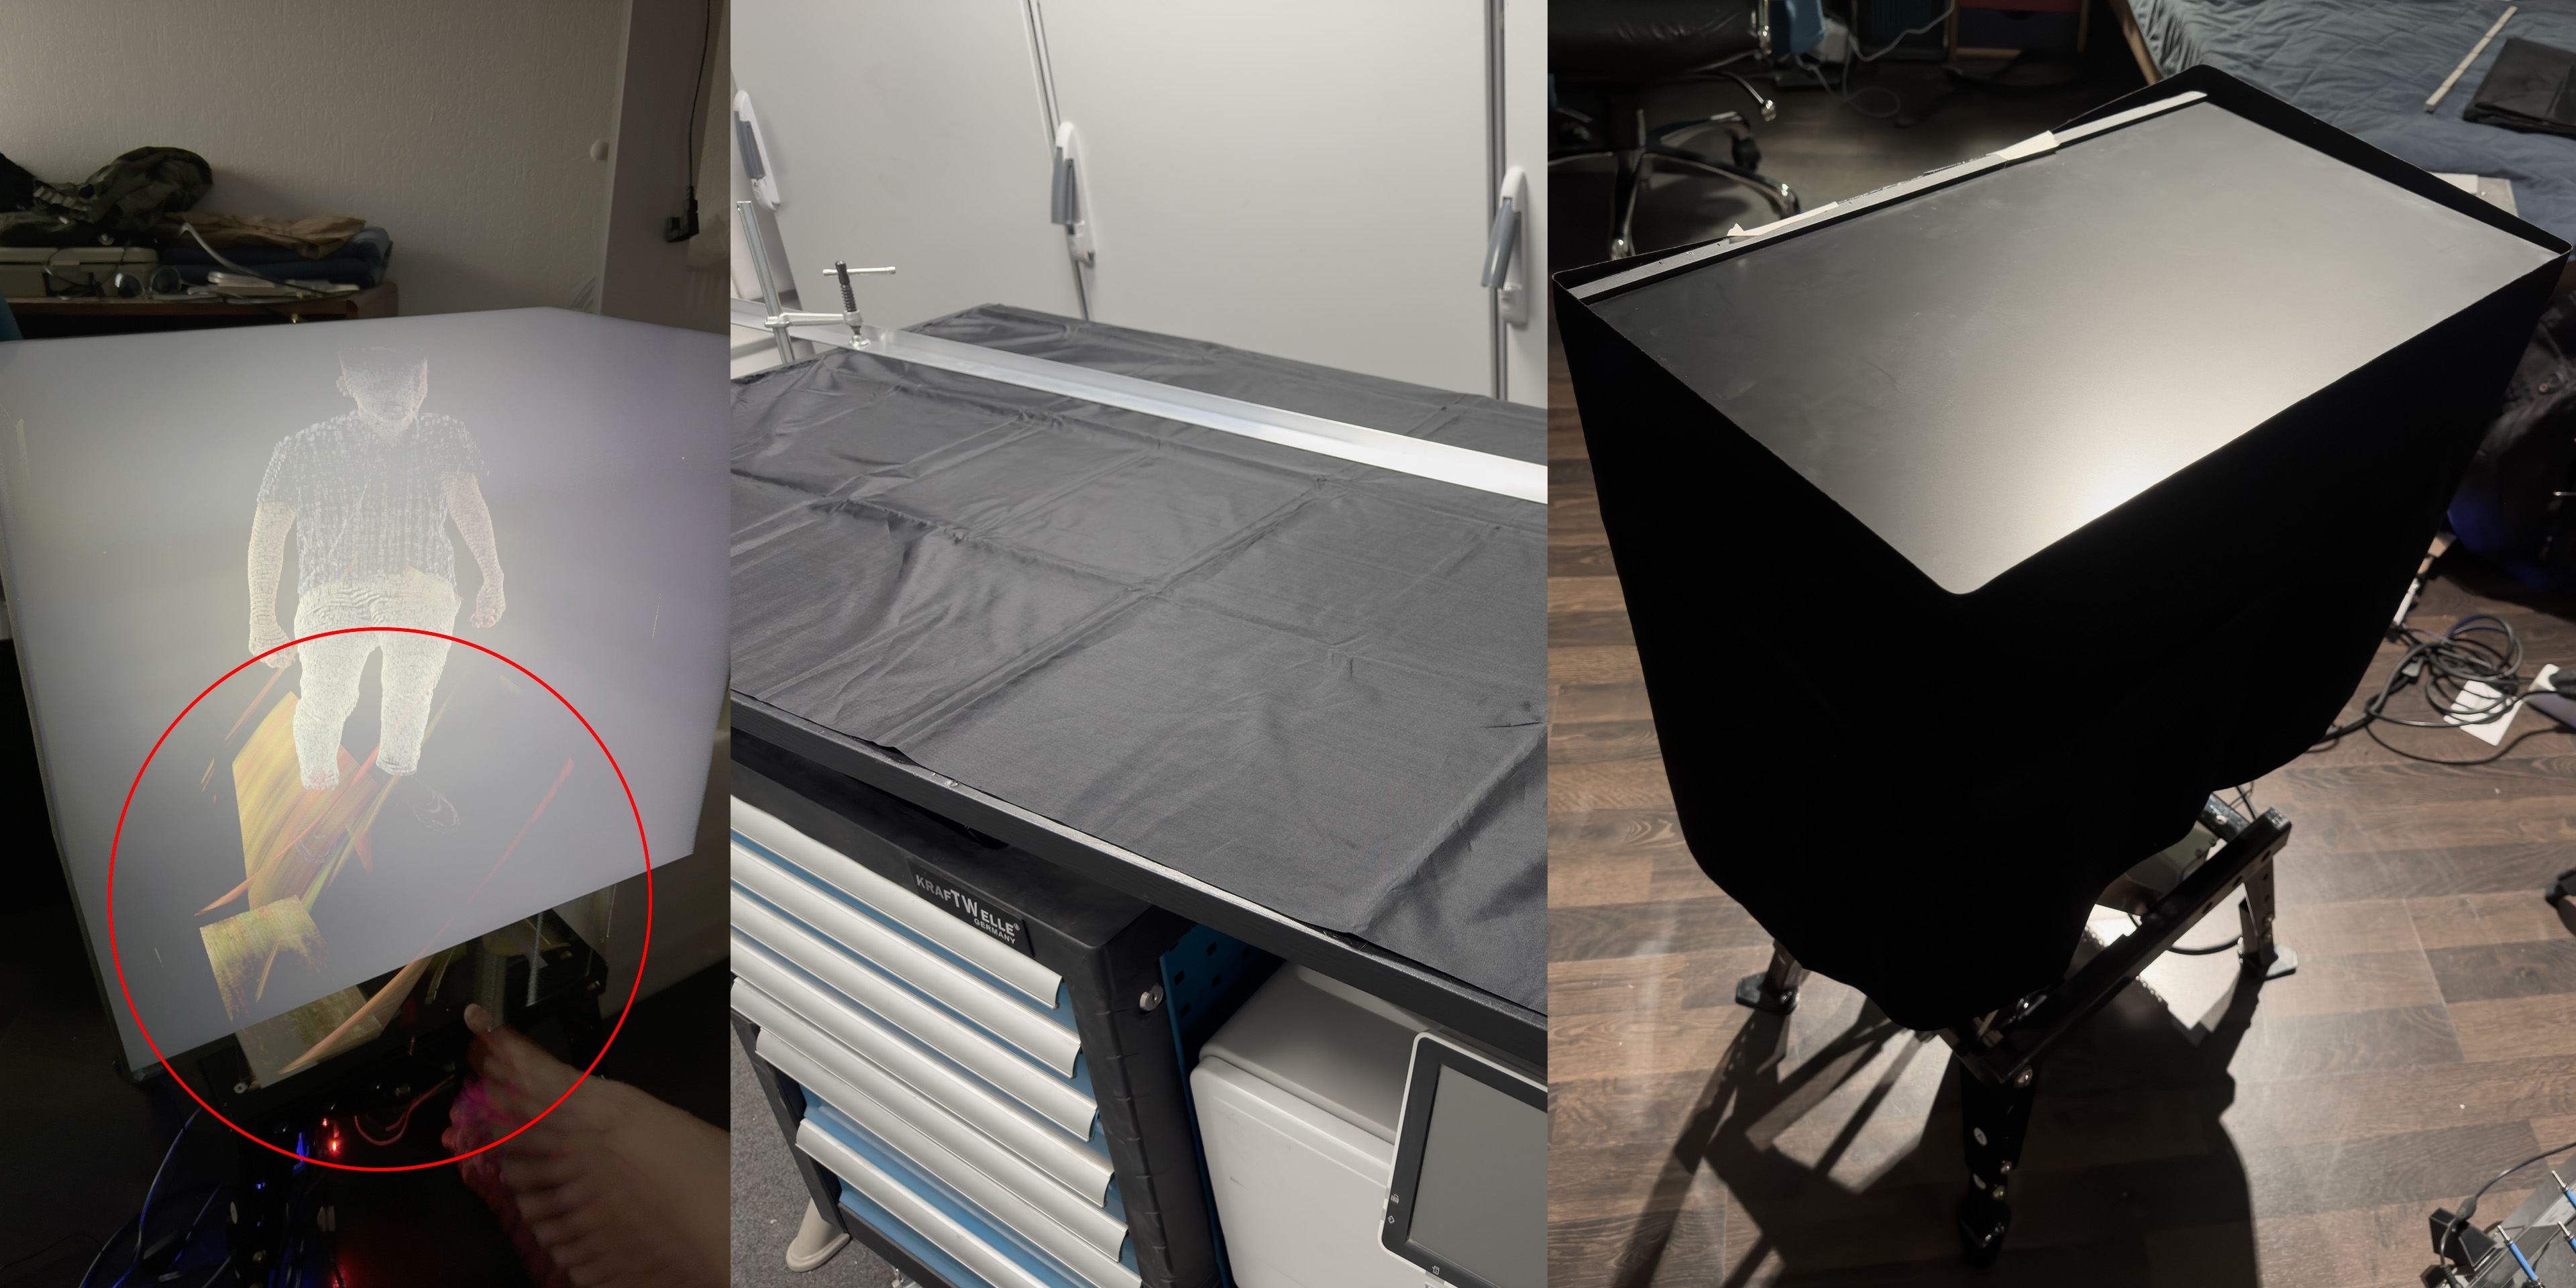
While some parts of the scissor lift were powder-coated black, the scissor arms were zinc-plated and given a chromate conversion coating, so they were shiny yellow, and during long exposures, they reflected light, causing artifacts in the volume. First, I tried to cover it in a black light-absorbing fabric used for photography backdrops. I attached it to the monitor with hook-and-loop tape. It worked, but it could get caught in the scissors, so I didn’t want to use it for long, unsupervised installations.
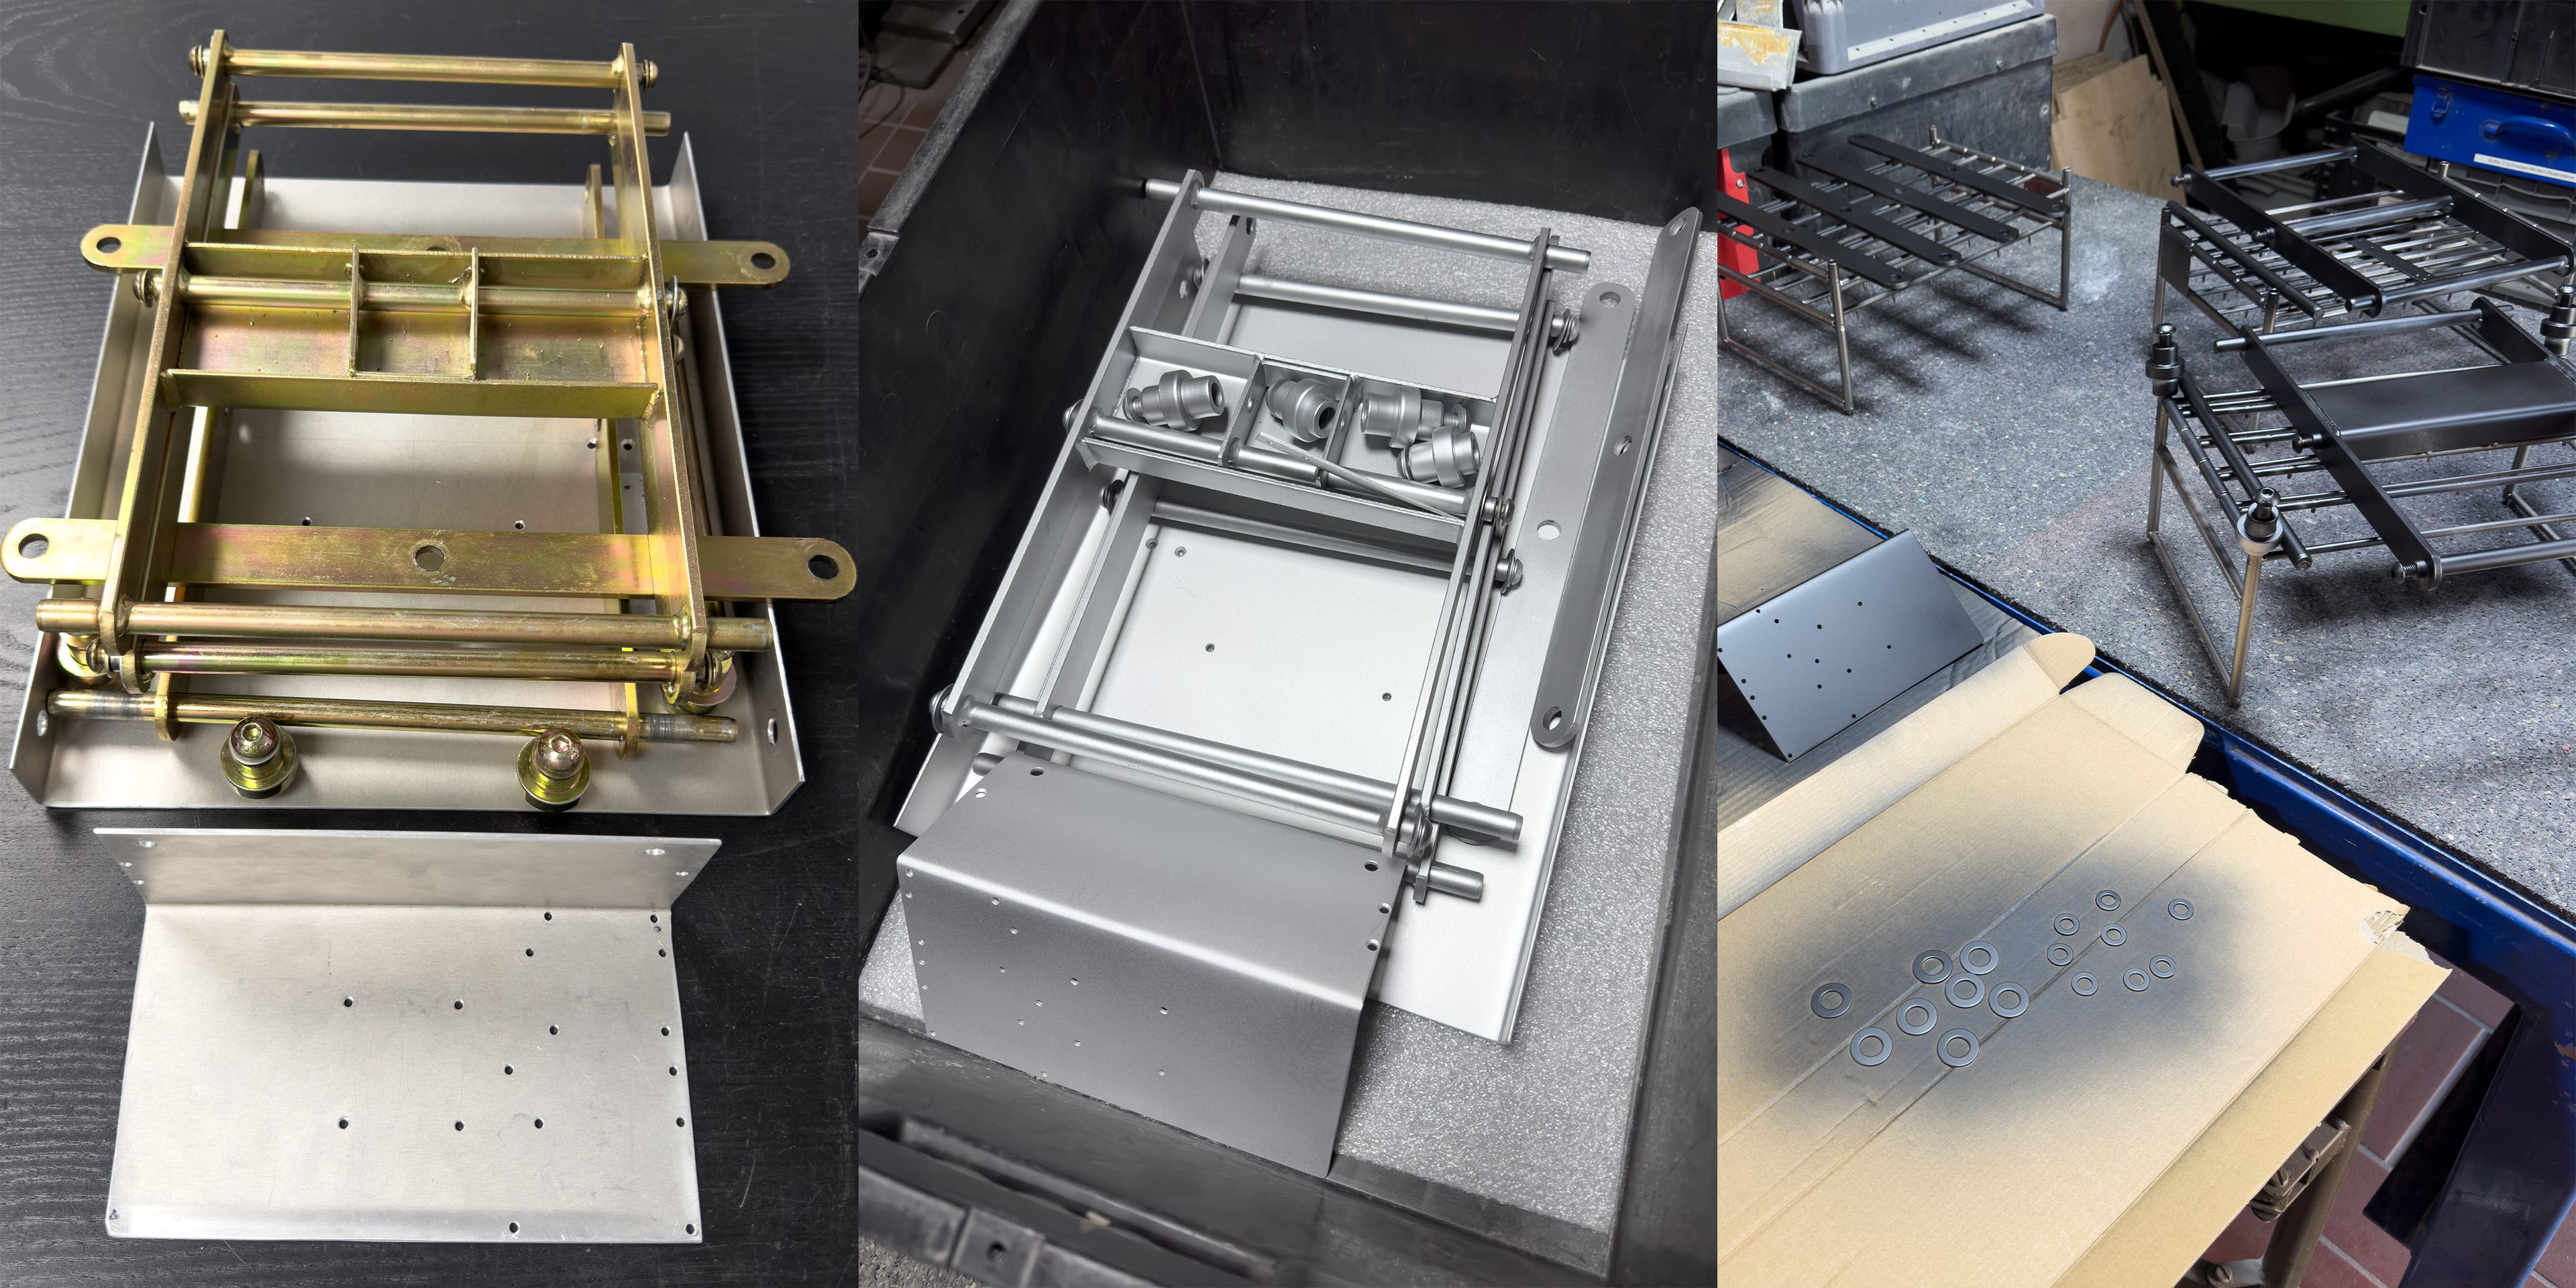
Instead, I disassembled the whole lift and sandblasted the shiny metal parts. Then I coated them in matte black car paint, reapplied grease to the joints, and reassembled the lift.
Dodecagon Ring
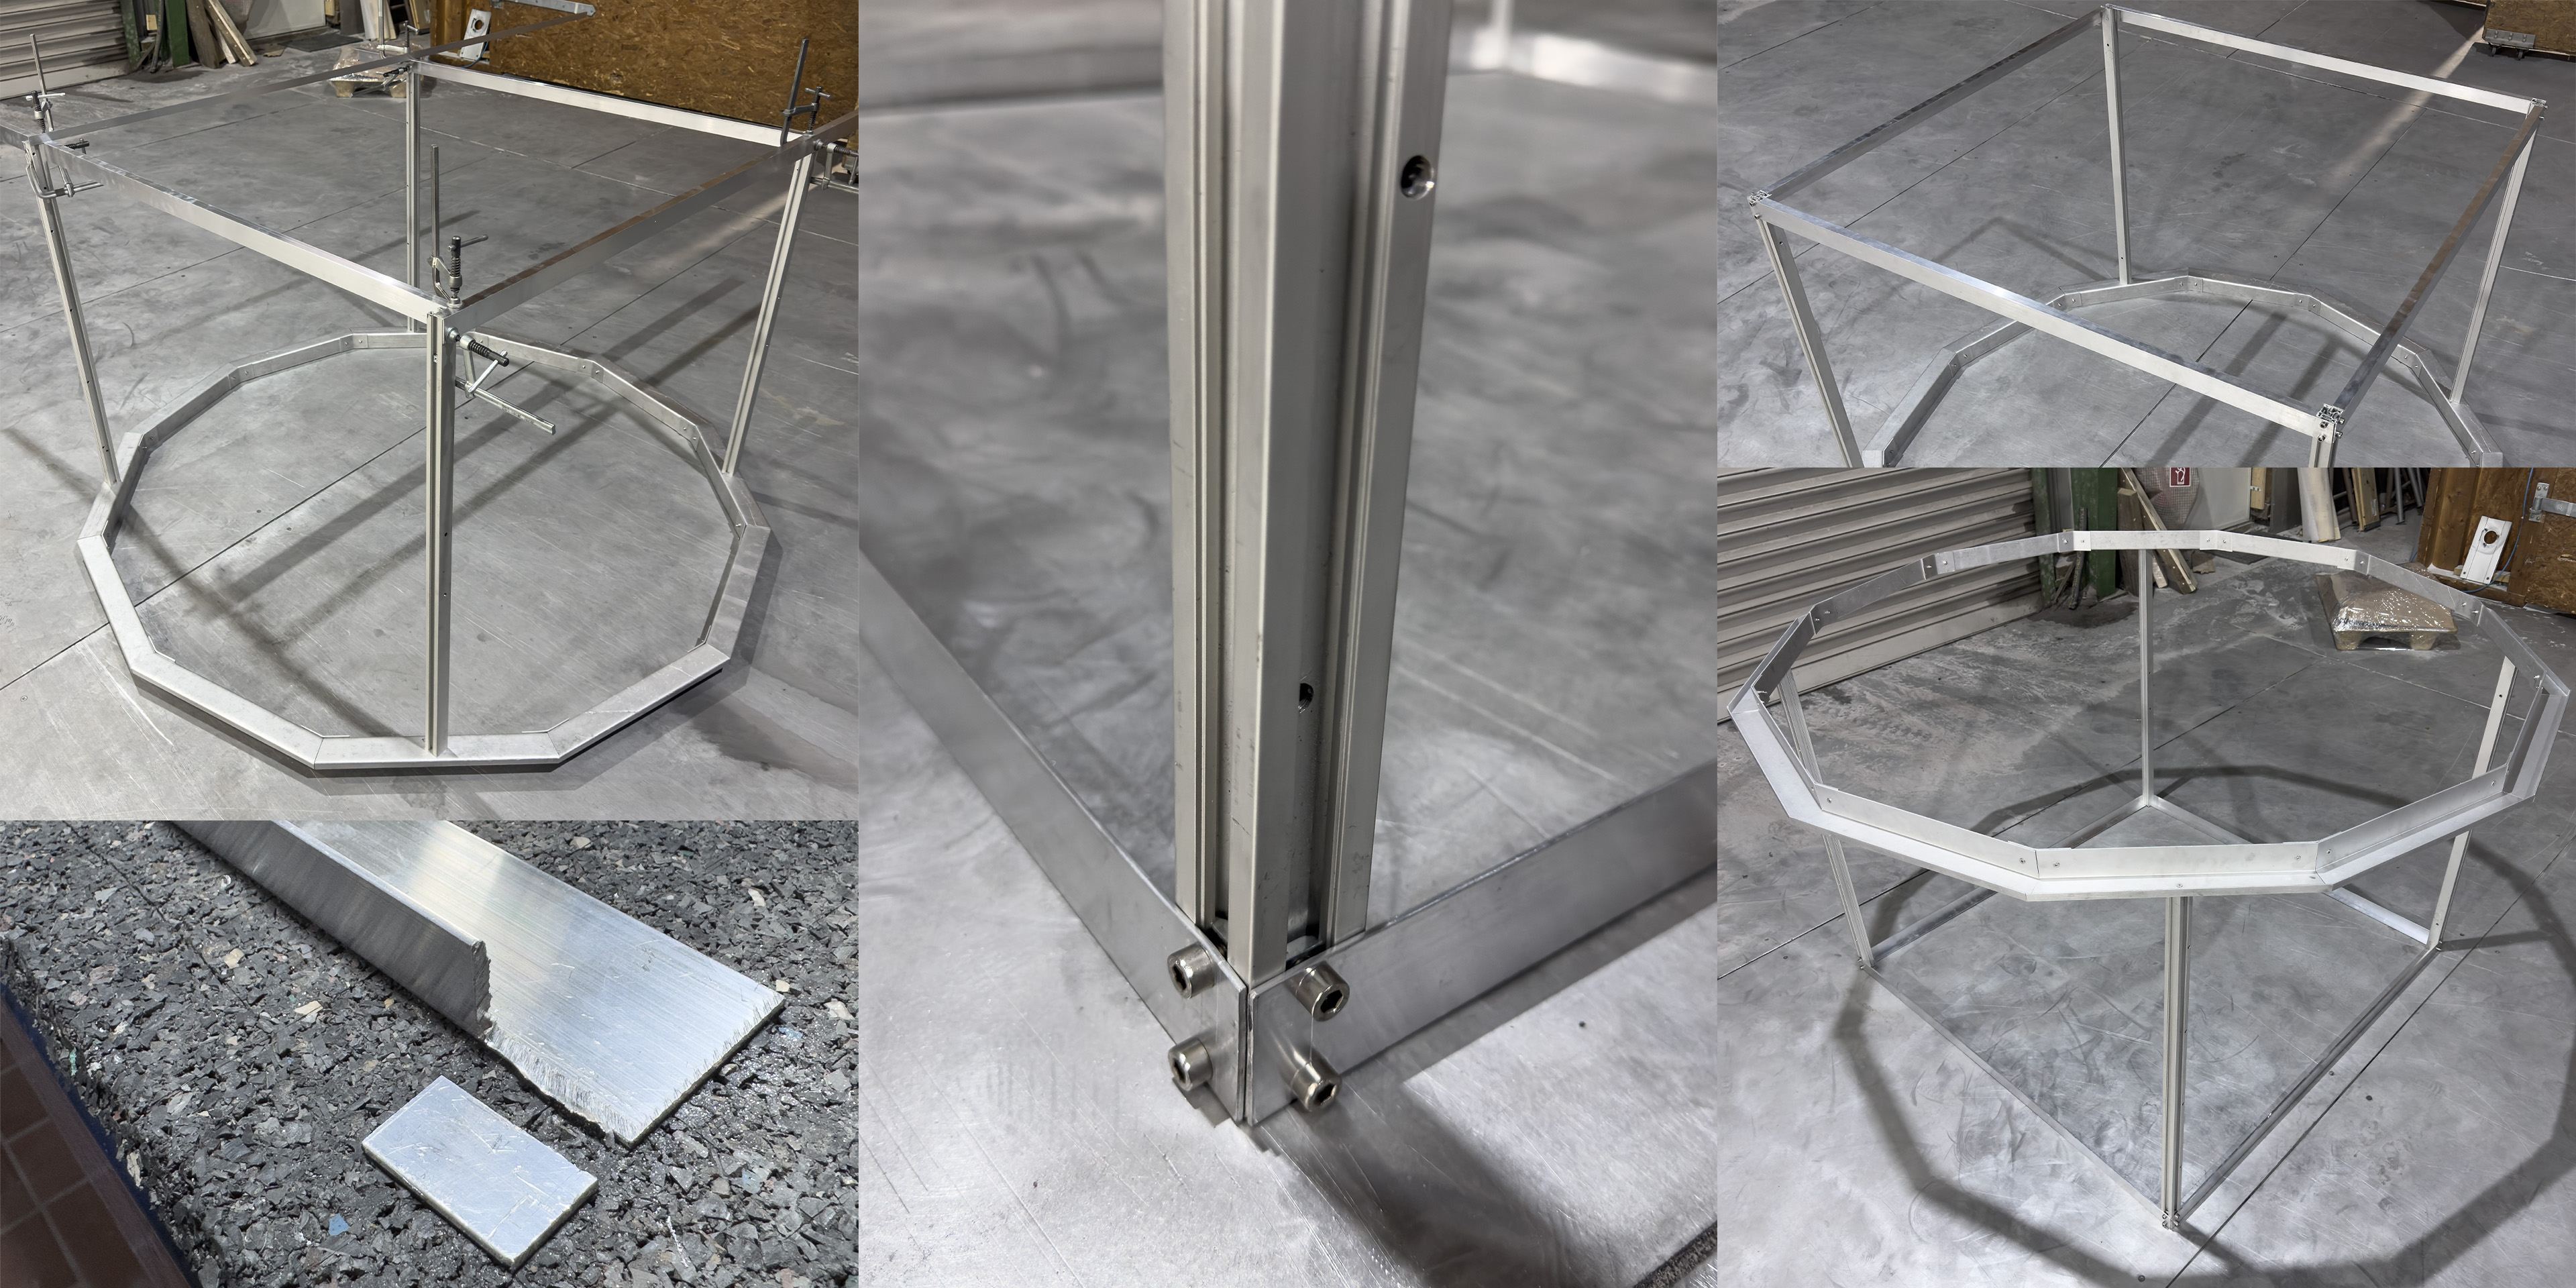
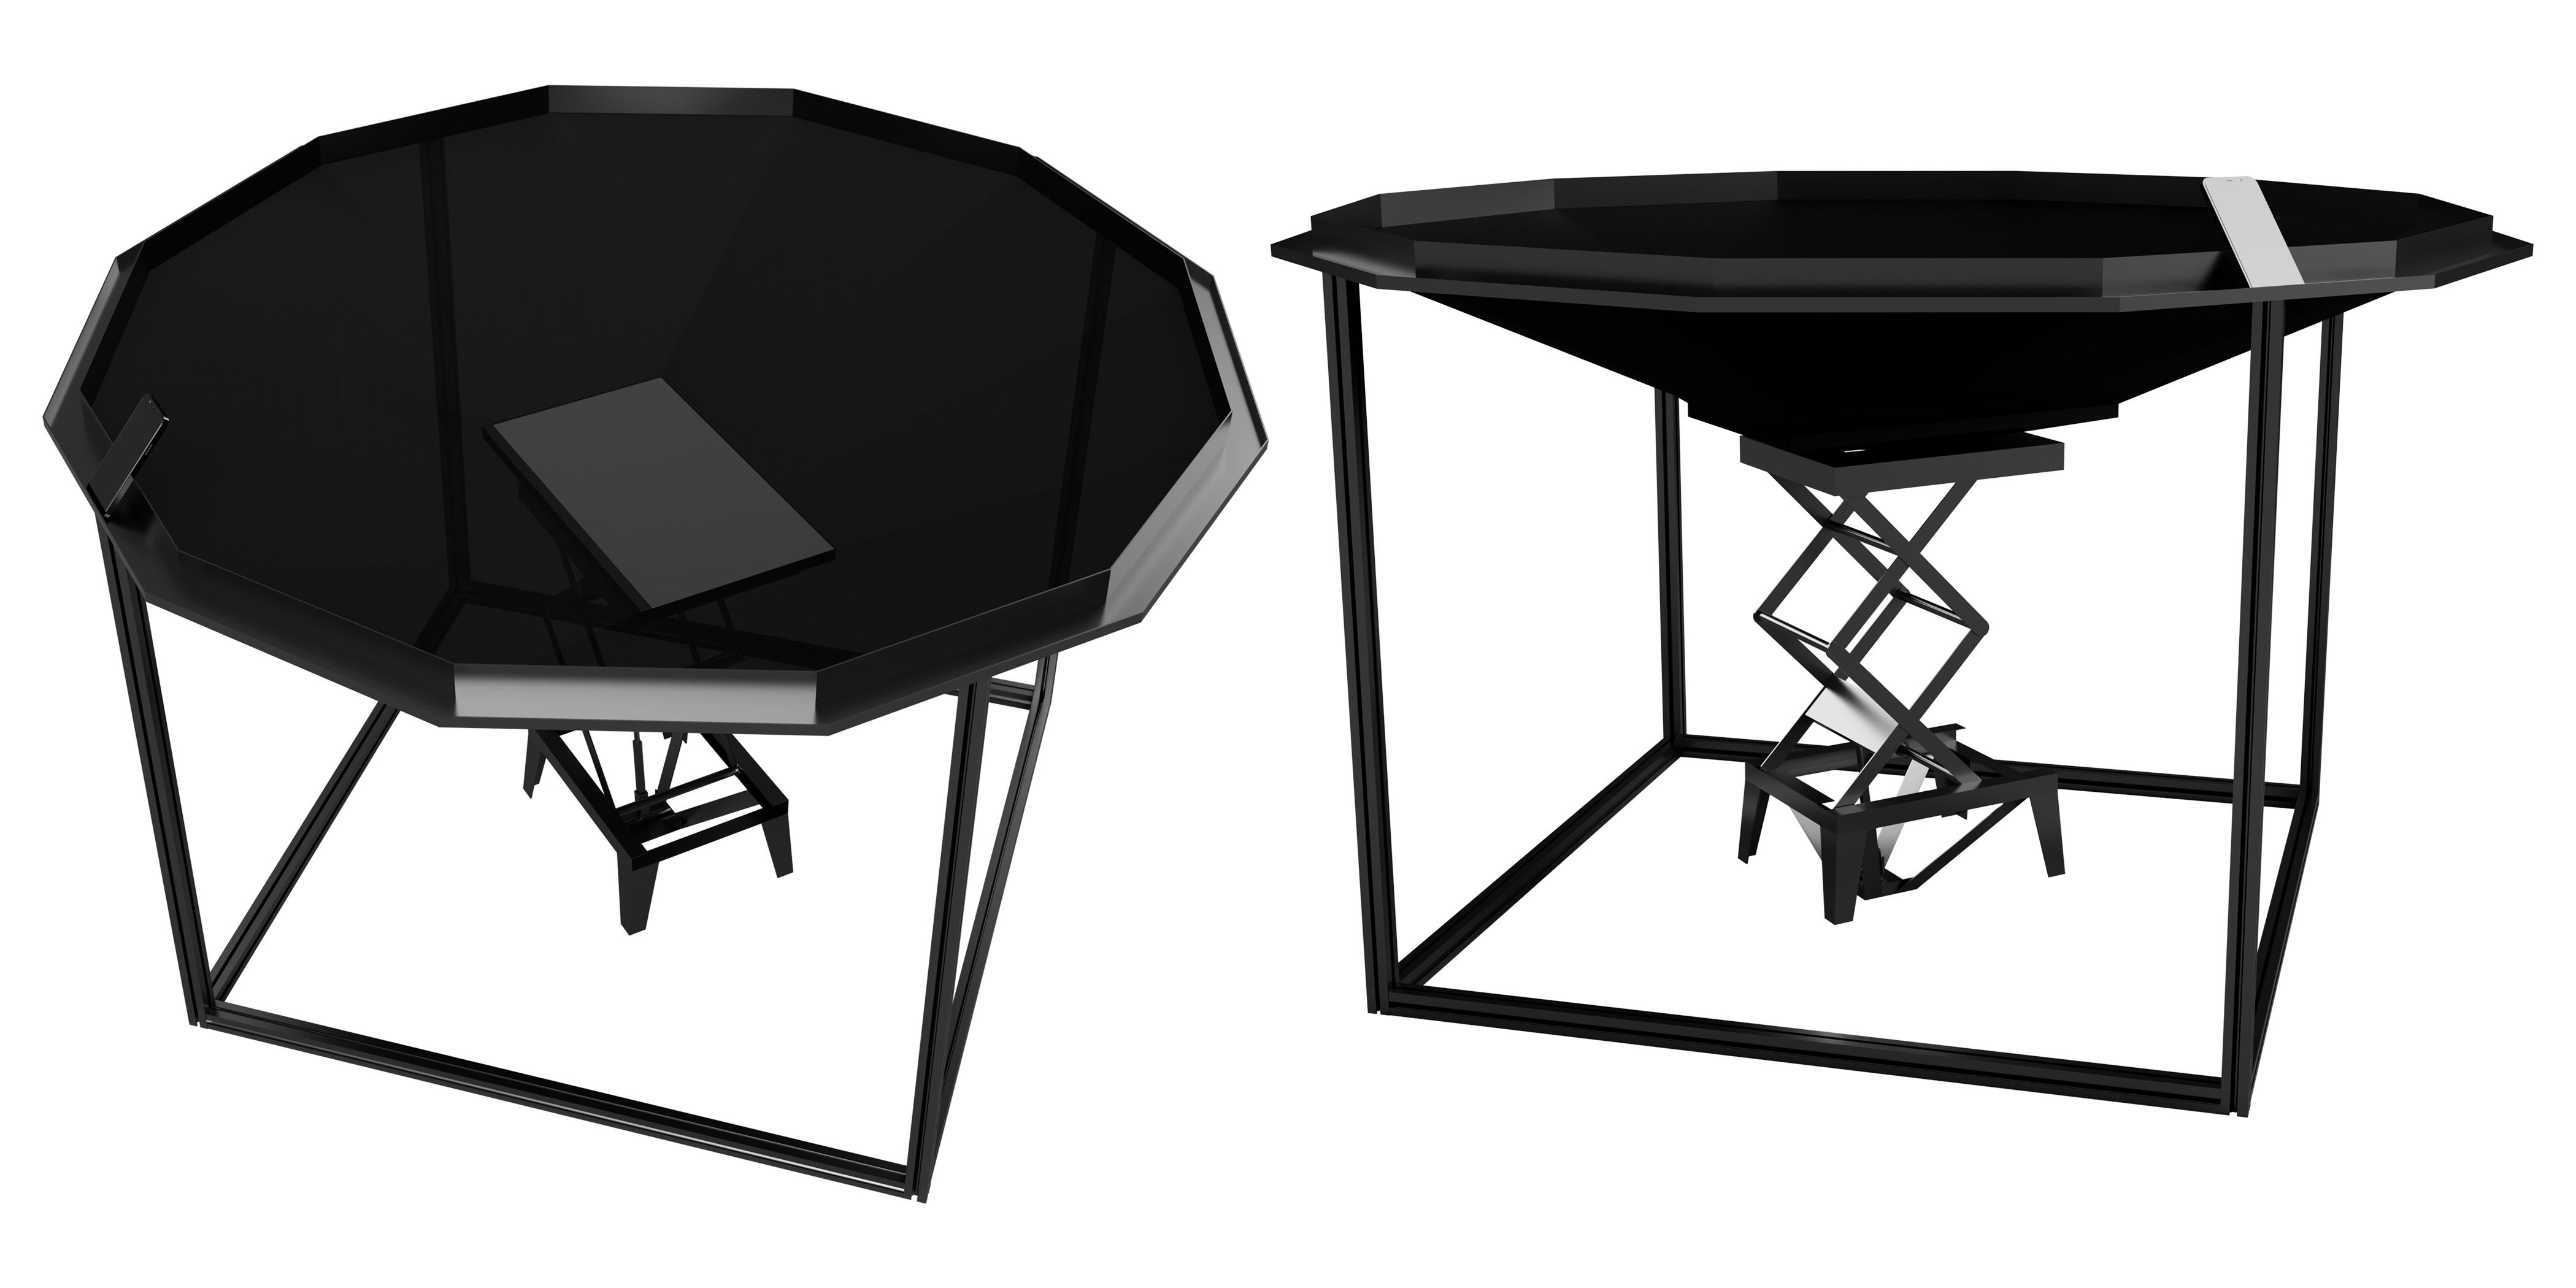
For the installation, I wanted a structure around the moving lift, for people to rest their phones to take stacked long-exposure photographs, and to prevent people from getting too close to the lift and accidentally getting hurt by the moving parts of the scissor lift. I did some experiments with cardboard and some 3D sketches in Fusion 360. One idea was to create a ring around the lift on which a phone can be placed in such a way that it perfectly faces the center of the moving monitor. Concerns about the manufacturing of such a ring led me to use a regular polygon instead. I settled on the 12-sided dodecagon as a compromise of roundness and number of parts. Also, I liked the parallels to the twelve numbers on the face of analog clocks.
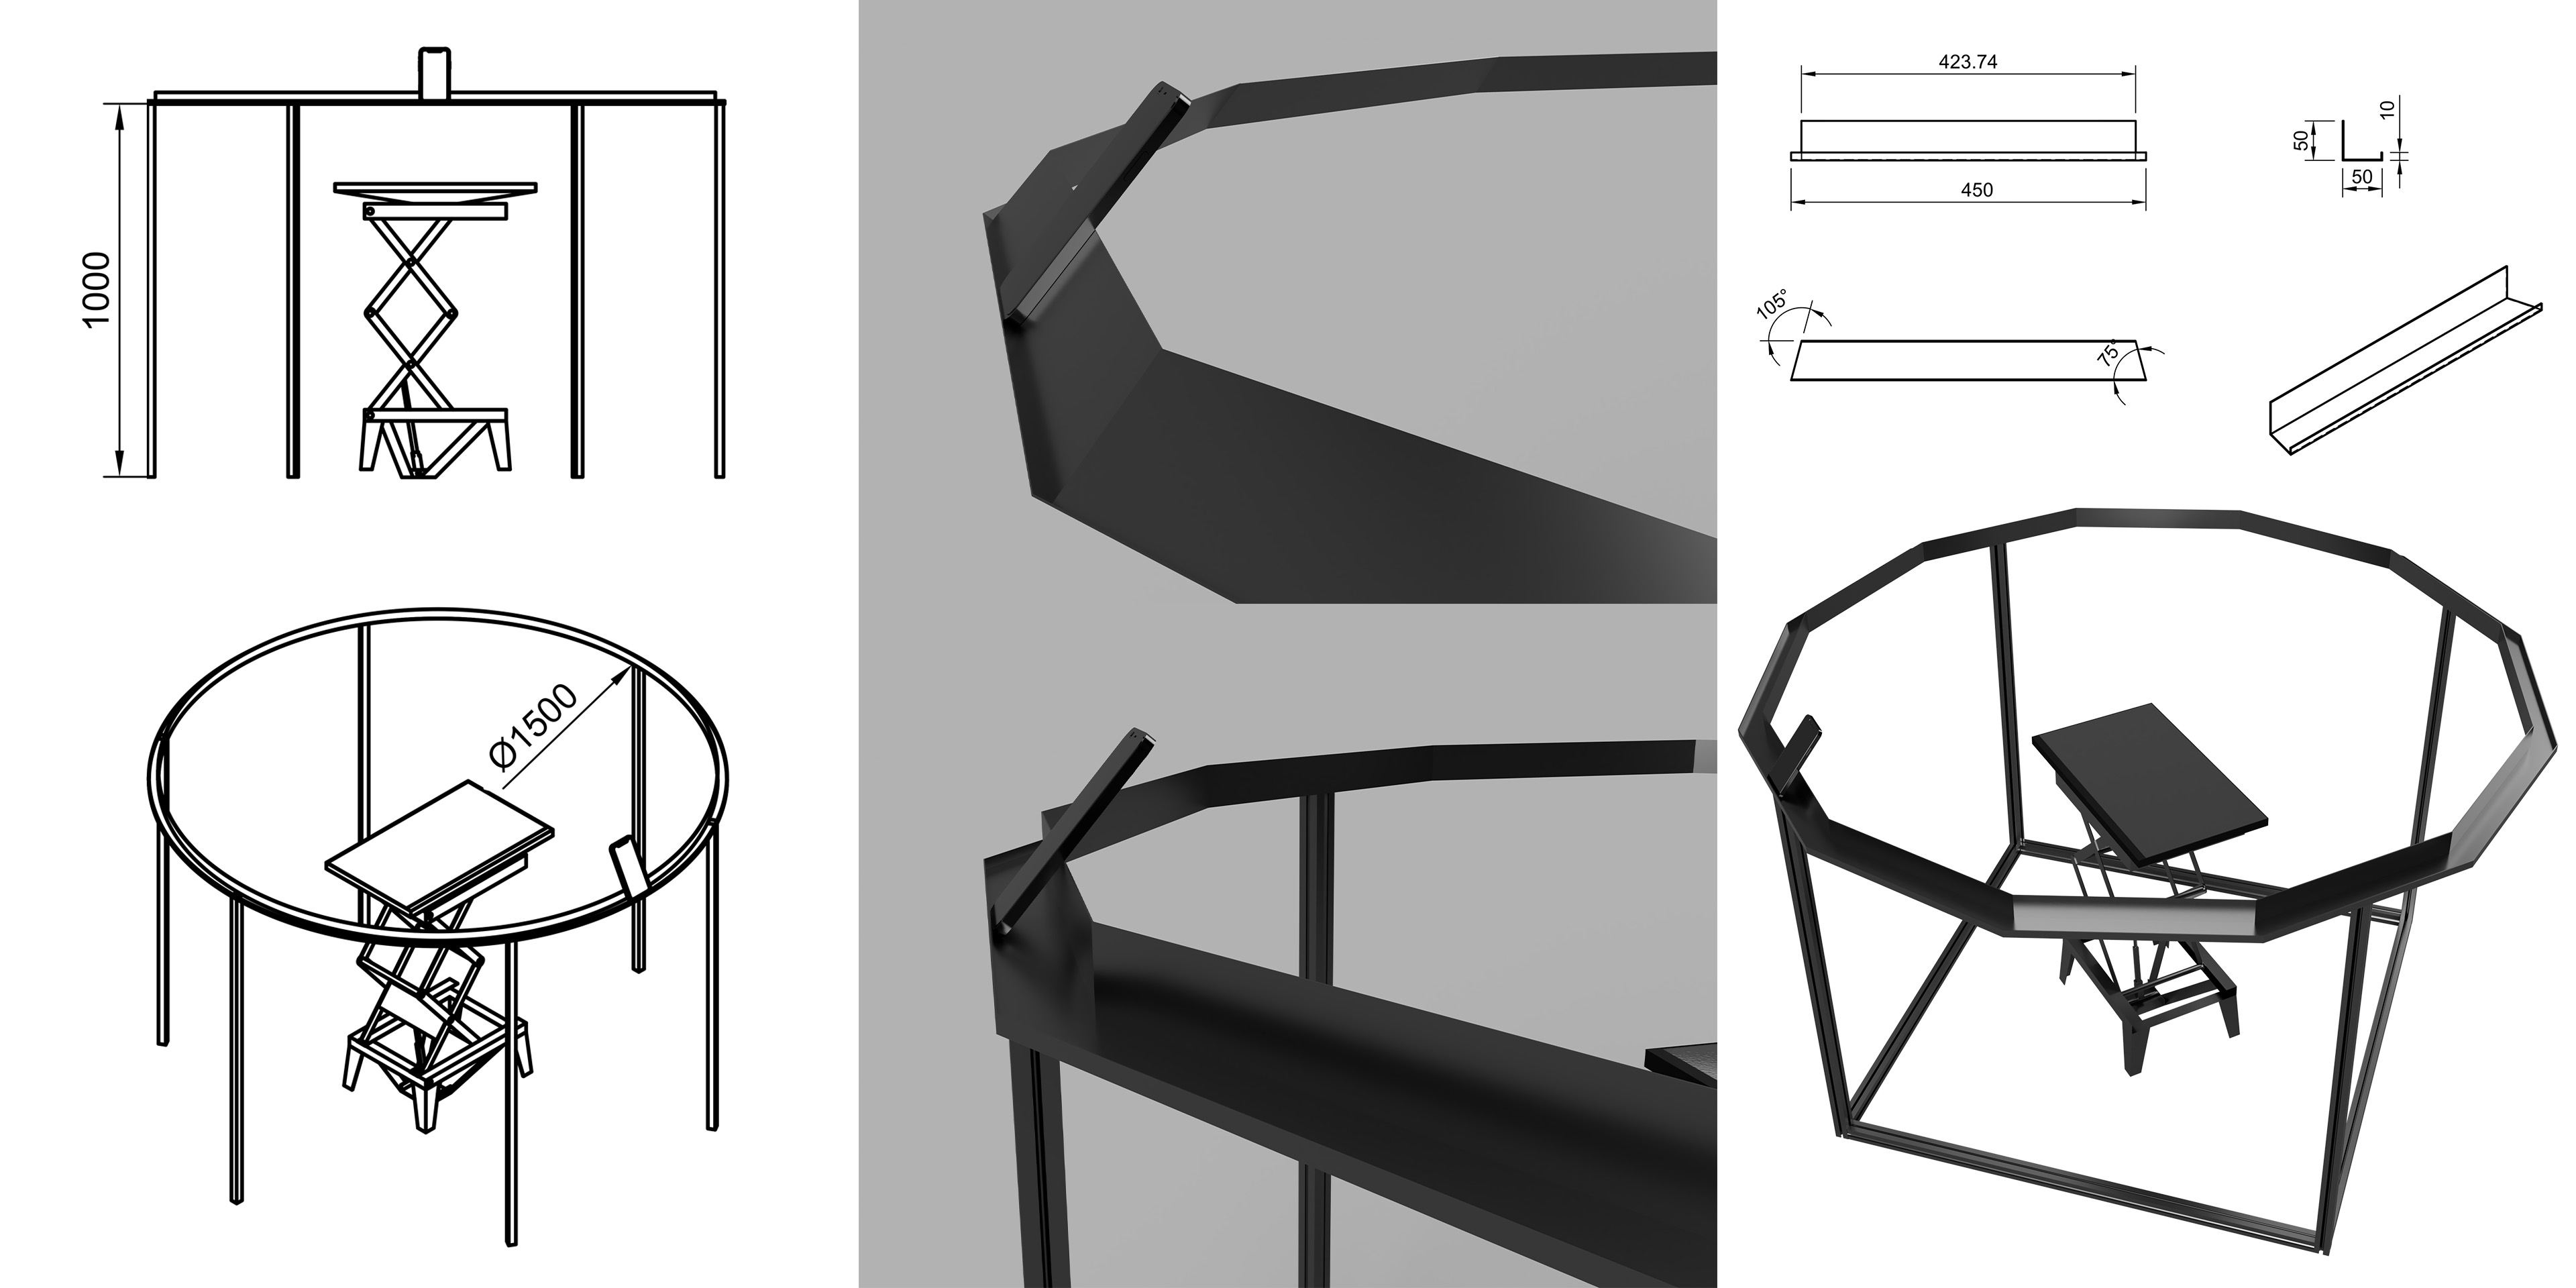
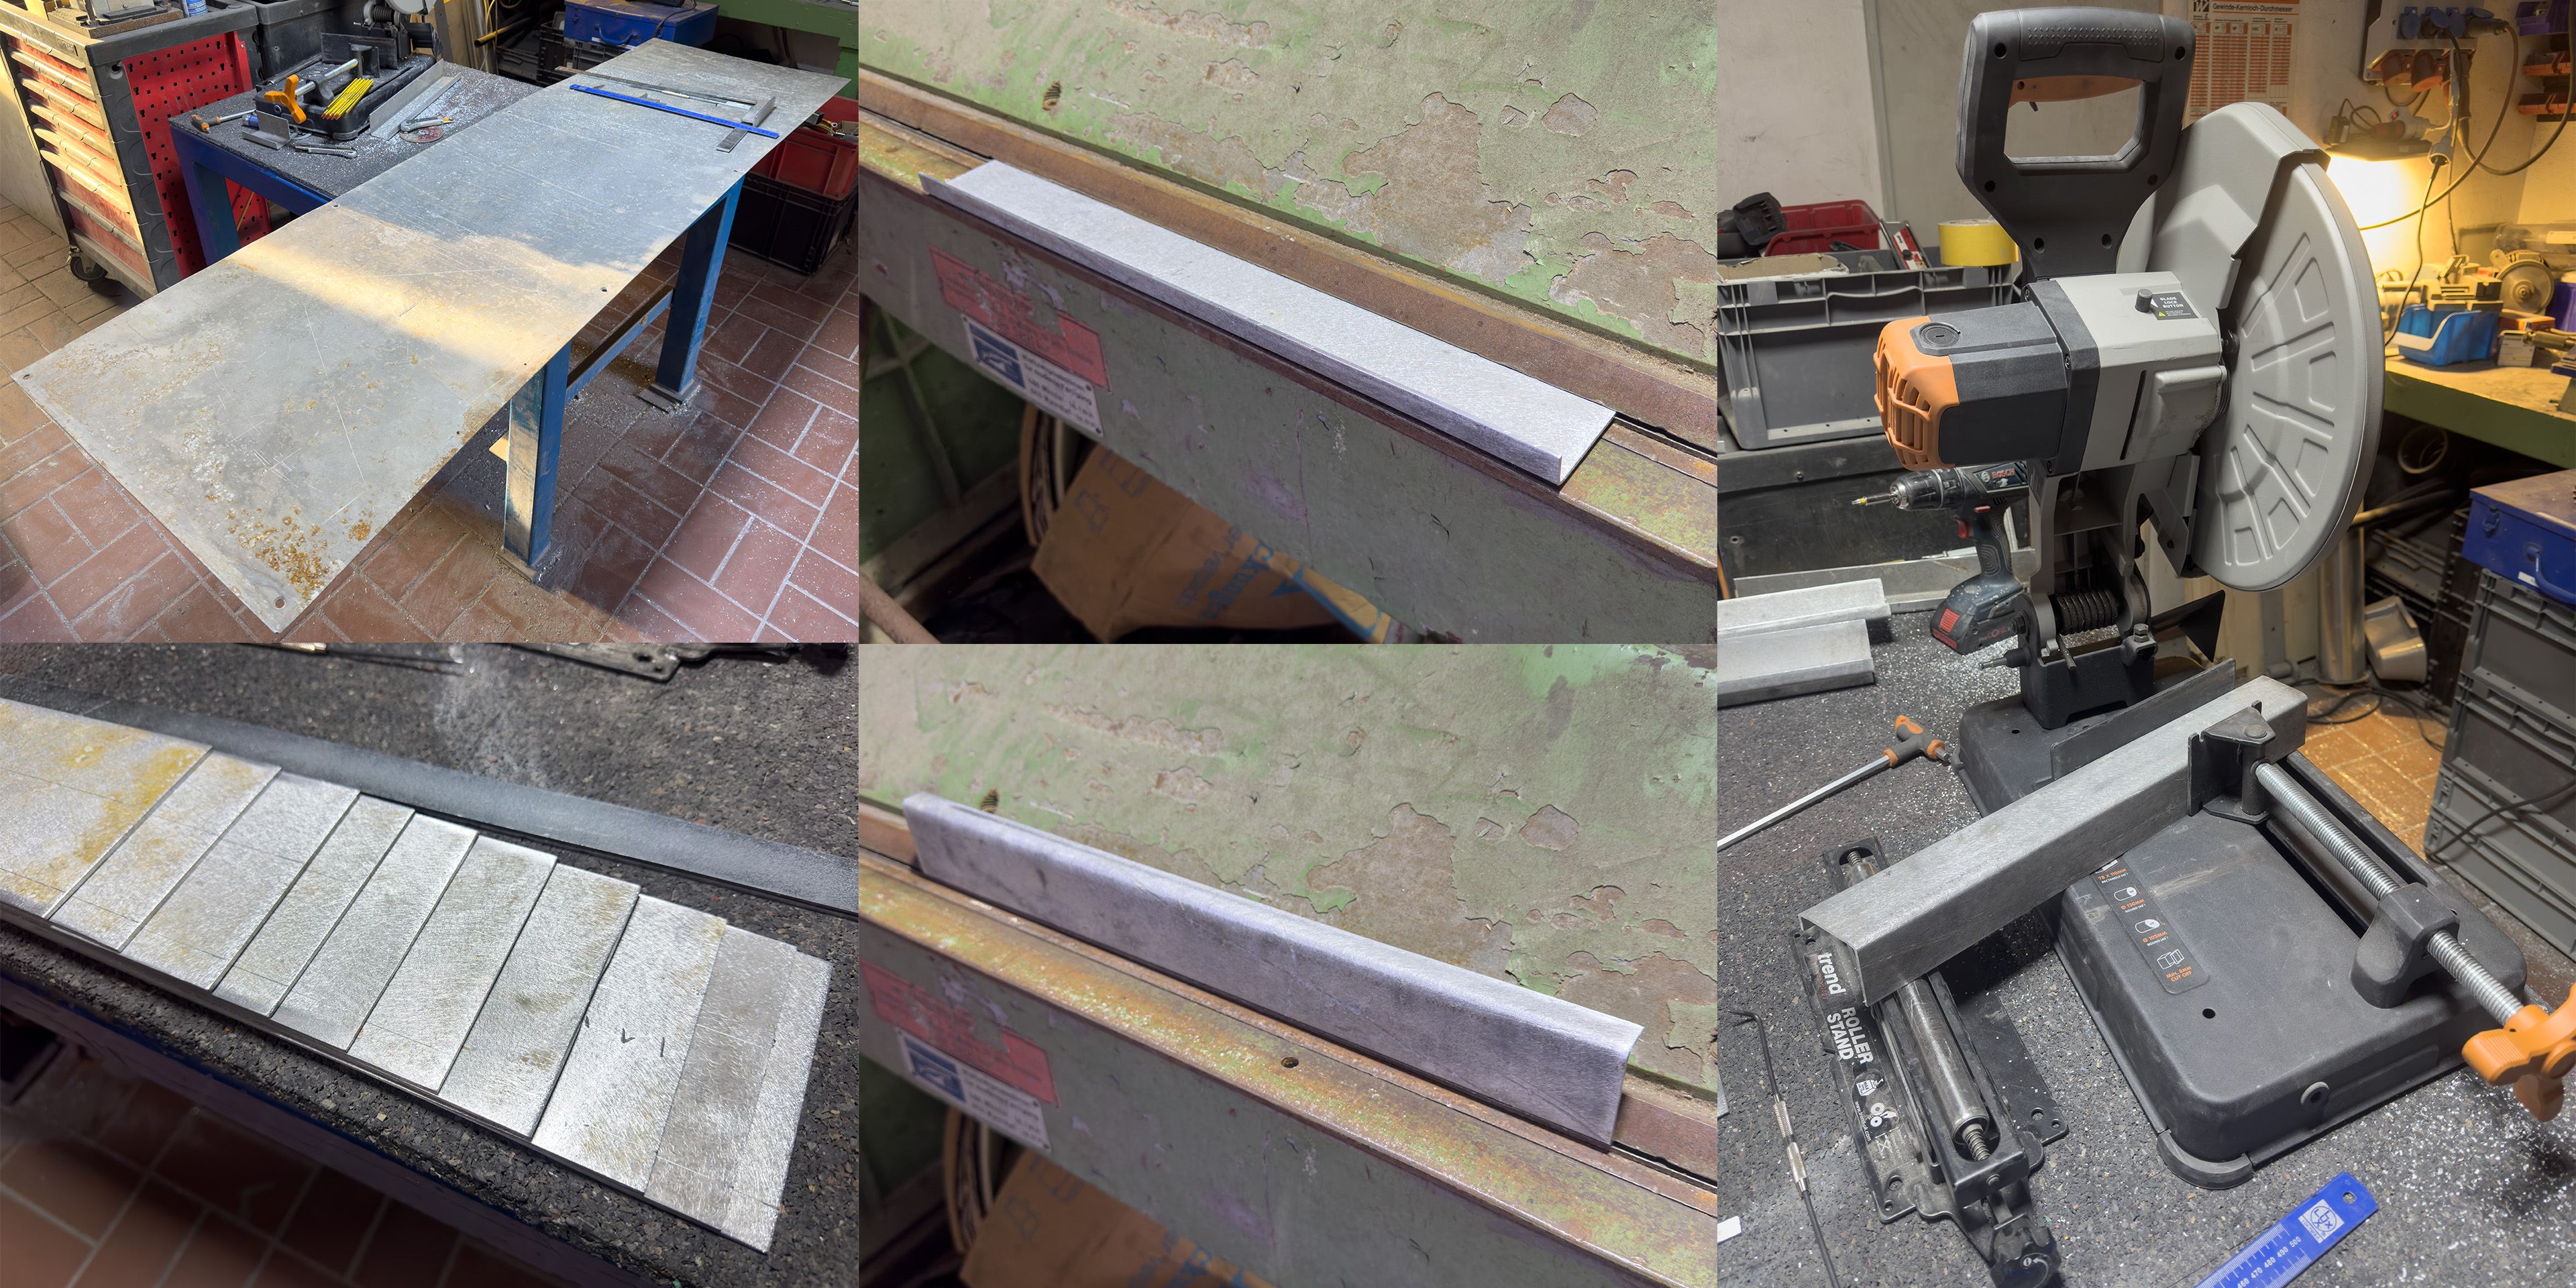
To get the right height, I built a cardboard prototype on an adjustable tripod. Then I cut a large aluminum scrap metal sheet into equal pieces, sanded the edges, and bent them into the right shapes. Then I cut each bent part at the correct angle (15°).
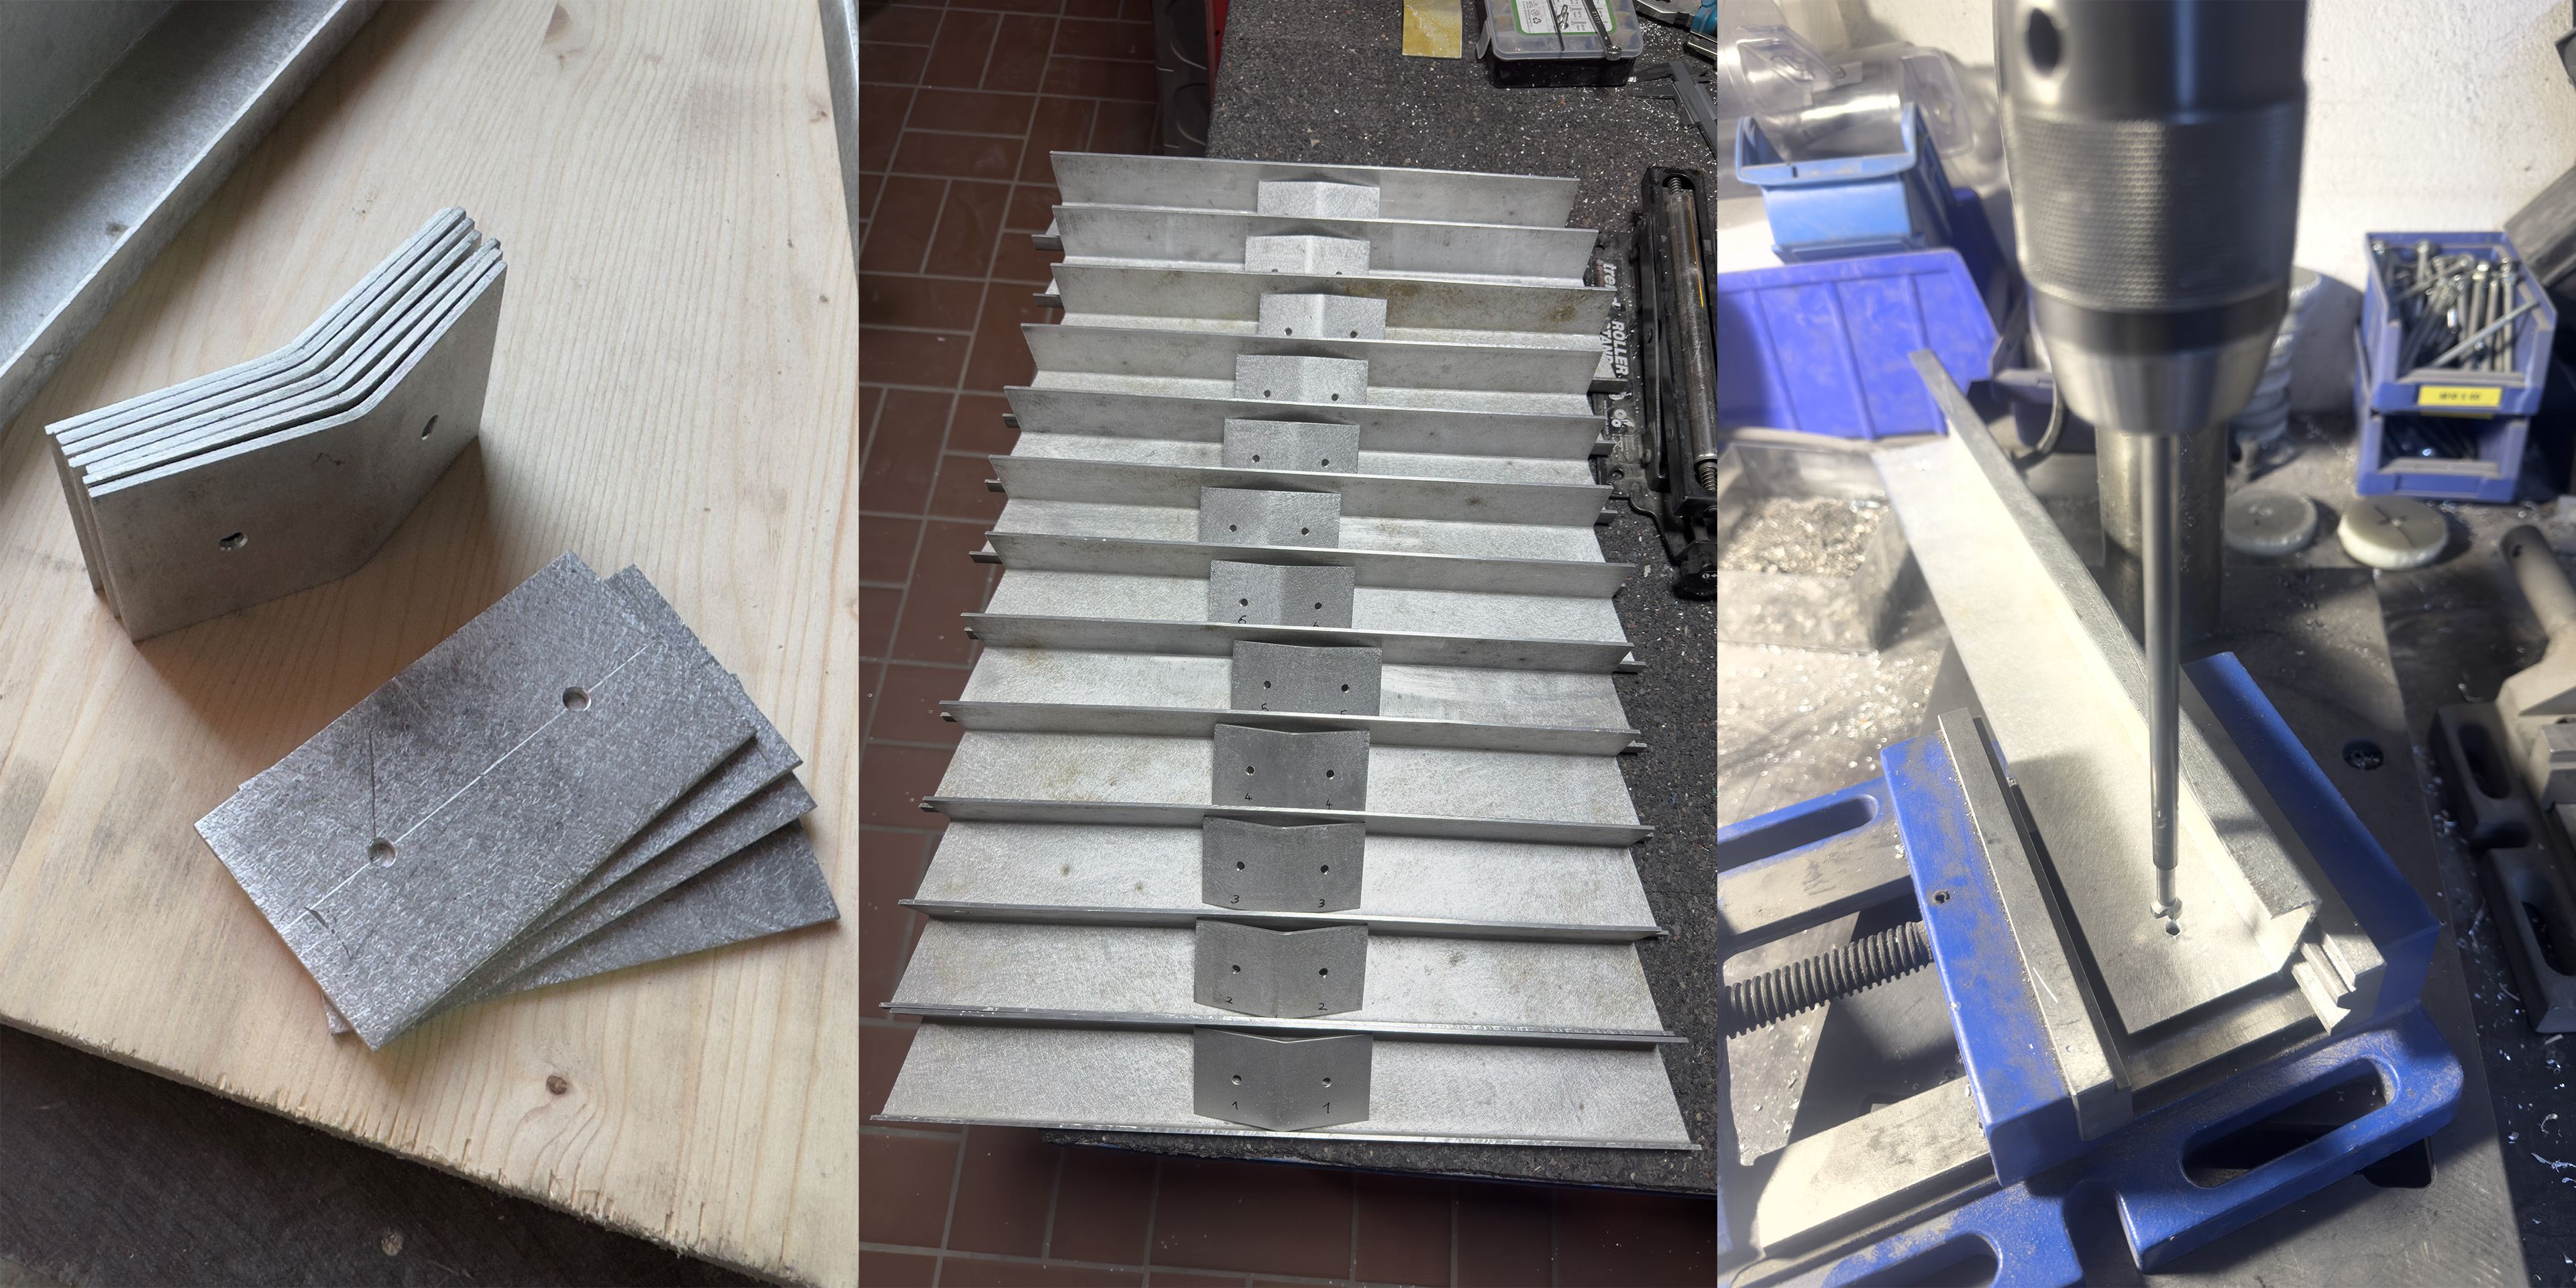
To connect them, I used leftover material from the same aluminum sheet and cut them into smaller pieces, measured and drilled holes in them, and then bent them to the correct angle (30°). I then used these connector pieces as templates for marking the holes in the larger segments and drilled countersunk holes in them. I numbered each part with a felt-tip pen to prevent mixing them up. Later, I also used a rotary tool to engrave the numbers more permanently.
I assembled the dodecagon and attached aluminum T-slot profiles to the center of every third segment as legs. It stood upright and functioned, but was still slightly unstable.
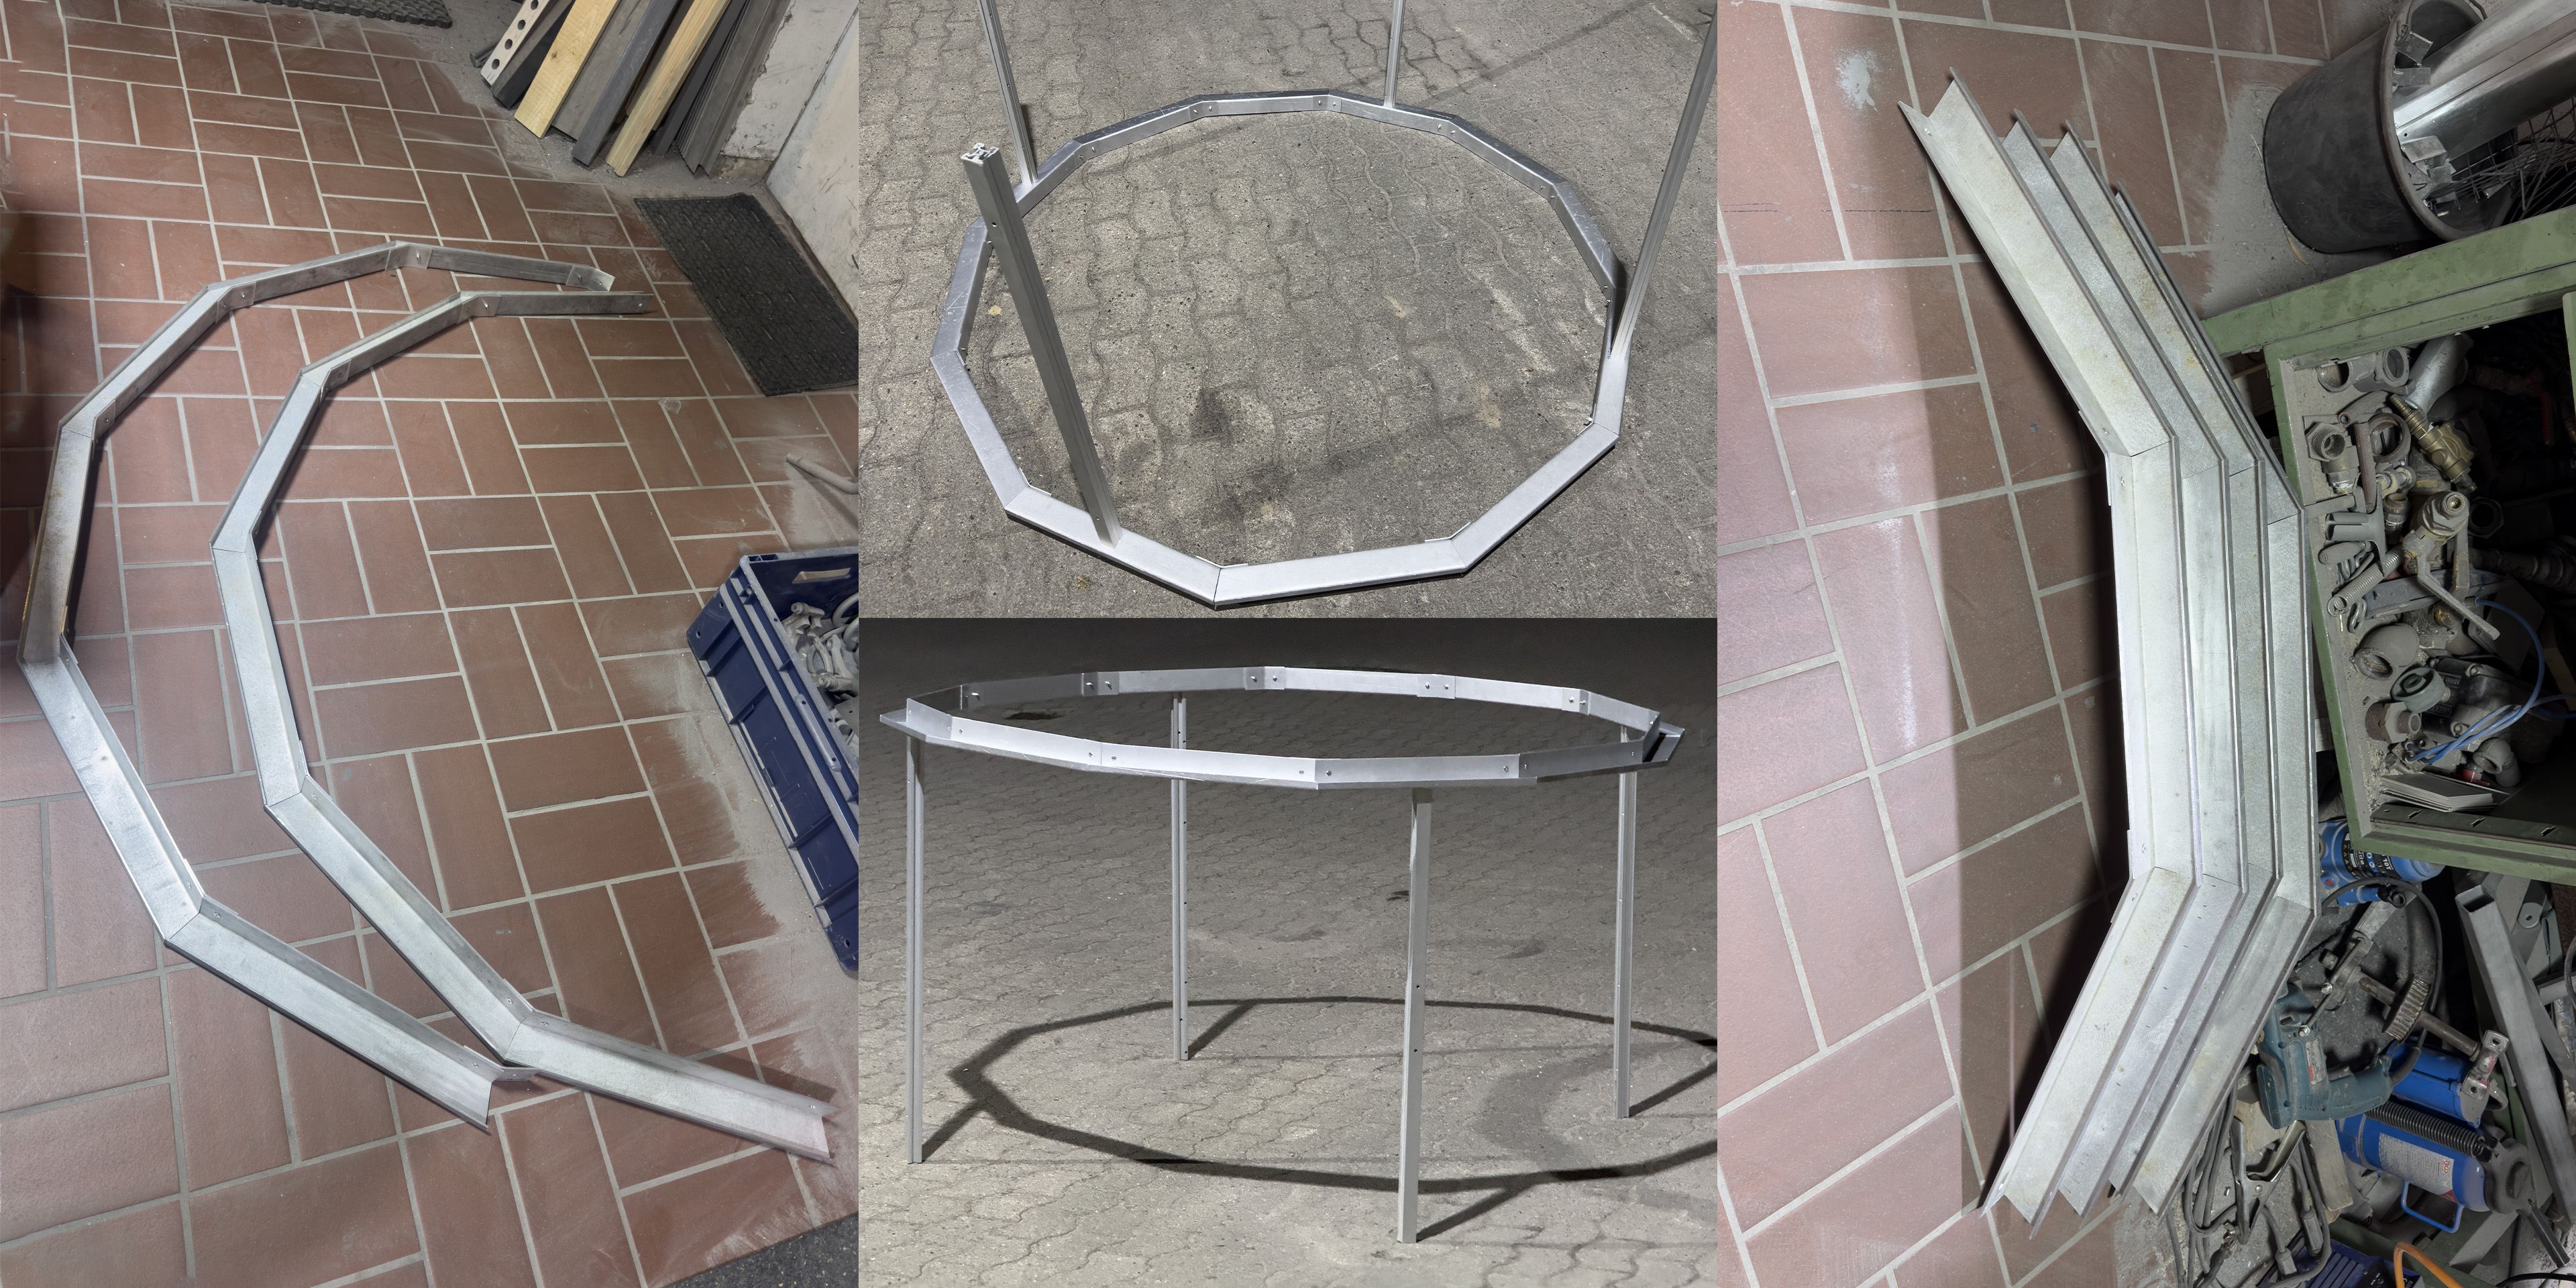
To increase the stability, I attached aluminum L-profiles to the grooves of the T-slot profiles.
Camera App
For the installation, I wanted to use the visitors’ phone cameras, but standard camera apps usually do not provide true long-exposure control. I also wanted to avoid making visitors install a new camera app and adjust their camera settings manually. As a compromise, I made a custom camera app that runs in the browser. Visitors can open it by scanning a QR code, and because it is a progressive web application, it can also be installed as a standalone full-screen app. One limitation of this approach is that mobile browsers only provide restricted access to the camera. Detailed camera controls such as exposure time, ISO, focus, and lens behavior are limited or inconsistent across mobile browsers, so I treated the camera as an automatic video source. Instead of capturing a true continuous long exposure, the web-based camera app records a sequence of video frames and stacks them into one final image. This simulates a long-exposure photograph while still working within the restrictions of the browser. It also has the benefit that the ambient light level does not need to be as low as it would be for a traditional long exposure, because the result is built from many short exposures rather than one long camera exposure that could blow out.
At first, I tried to host the camera app directly on the Raspberry Pi. This would have allowed the app to communicate more directly with the installation and receive information about the current sequence and automatically time the recording. But the problem was that most smartphone browsers treated the local connection as a security risk, especially because camera access in the browser usually requires a trusted, secure connection. Therefore, I decided to host it on GitHub Pages instead. The app itself is built as a static web app with a web app manifest and a service worker. The manifest allows it to be added to the home screen and opened in standalone portrait mode, which makes it feel more like a native camera app during the installation. The service worker caches the necessary files after the first visit, so the app can continue running locally on the visitor’s phone even if the connection is lost. This means that the installation does not need a continuous network connection for communication once the app has been loaded.
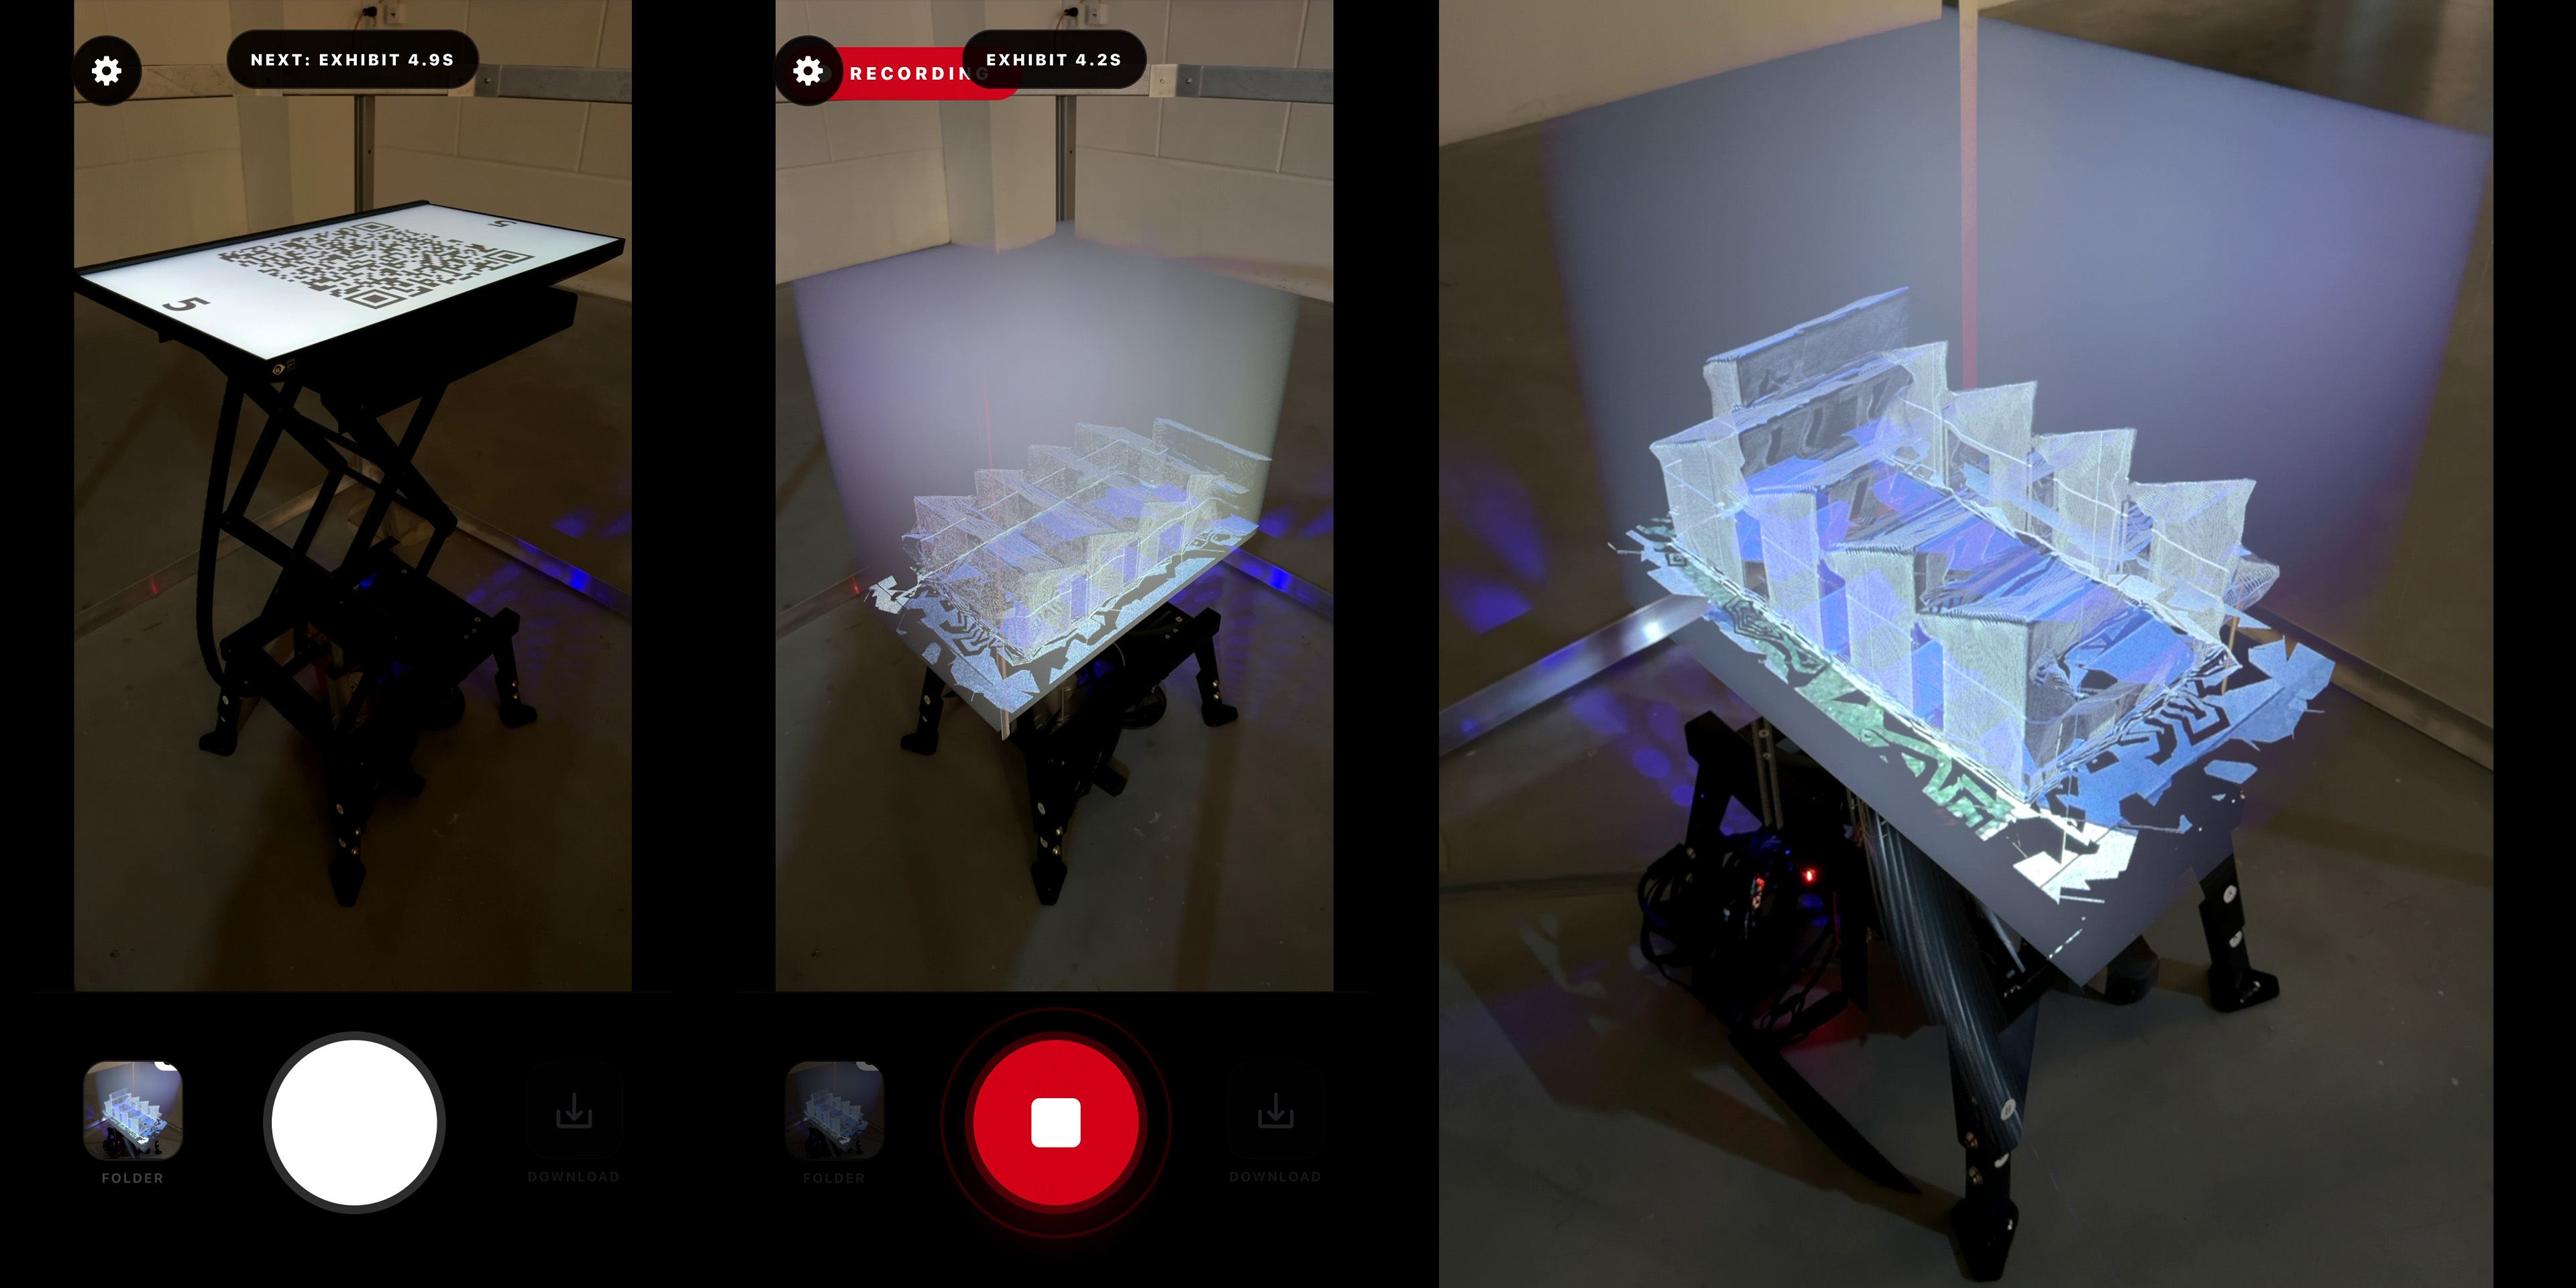
To transfer timing information without a direct network connection between the Raspberry Pi and the visitors’ phones, I used QR codes between sequences. The QR code contains the camera app’s URL and query-string parameters with information about the current and upcoming sequences.
The camera app can read the sequence name, its duration, and the scheduled start time. The QR code updates every second, so the countdown stays current, and the app can start and stop recording at the right time. It also includes the timing of the next three sequences. This way, even if the QR code fails to scan, which can occur sometimes when the lift is extended, and the code is at a shallow angle, the app can remain synchronized with the installation. QR sync can be turned off in the settings, and the automatic recording can be overridden with the record button.
The app also includes several settings that change how the final image is created. The user can choose the blending mode, select which camera lens to use, decide whether the result should stay on the screen after recording, and choose whether captures should be saved in the app’s local image folder.
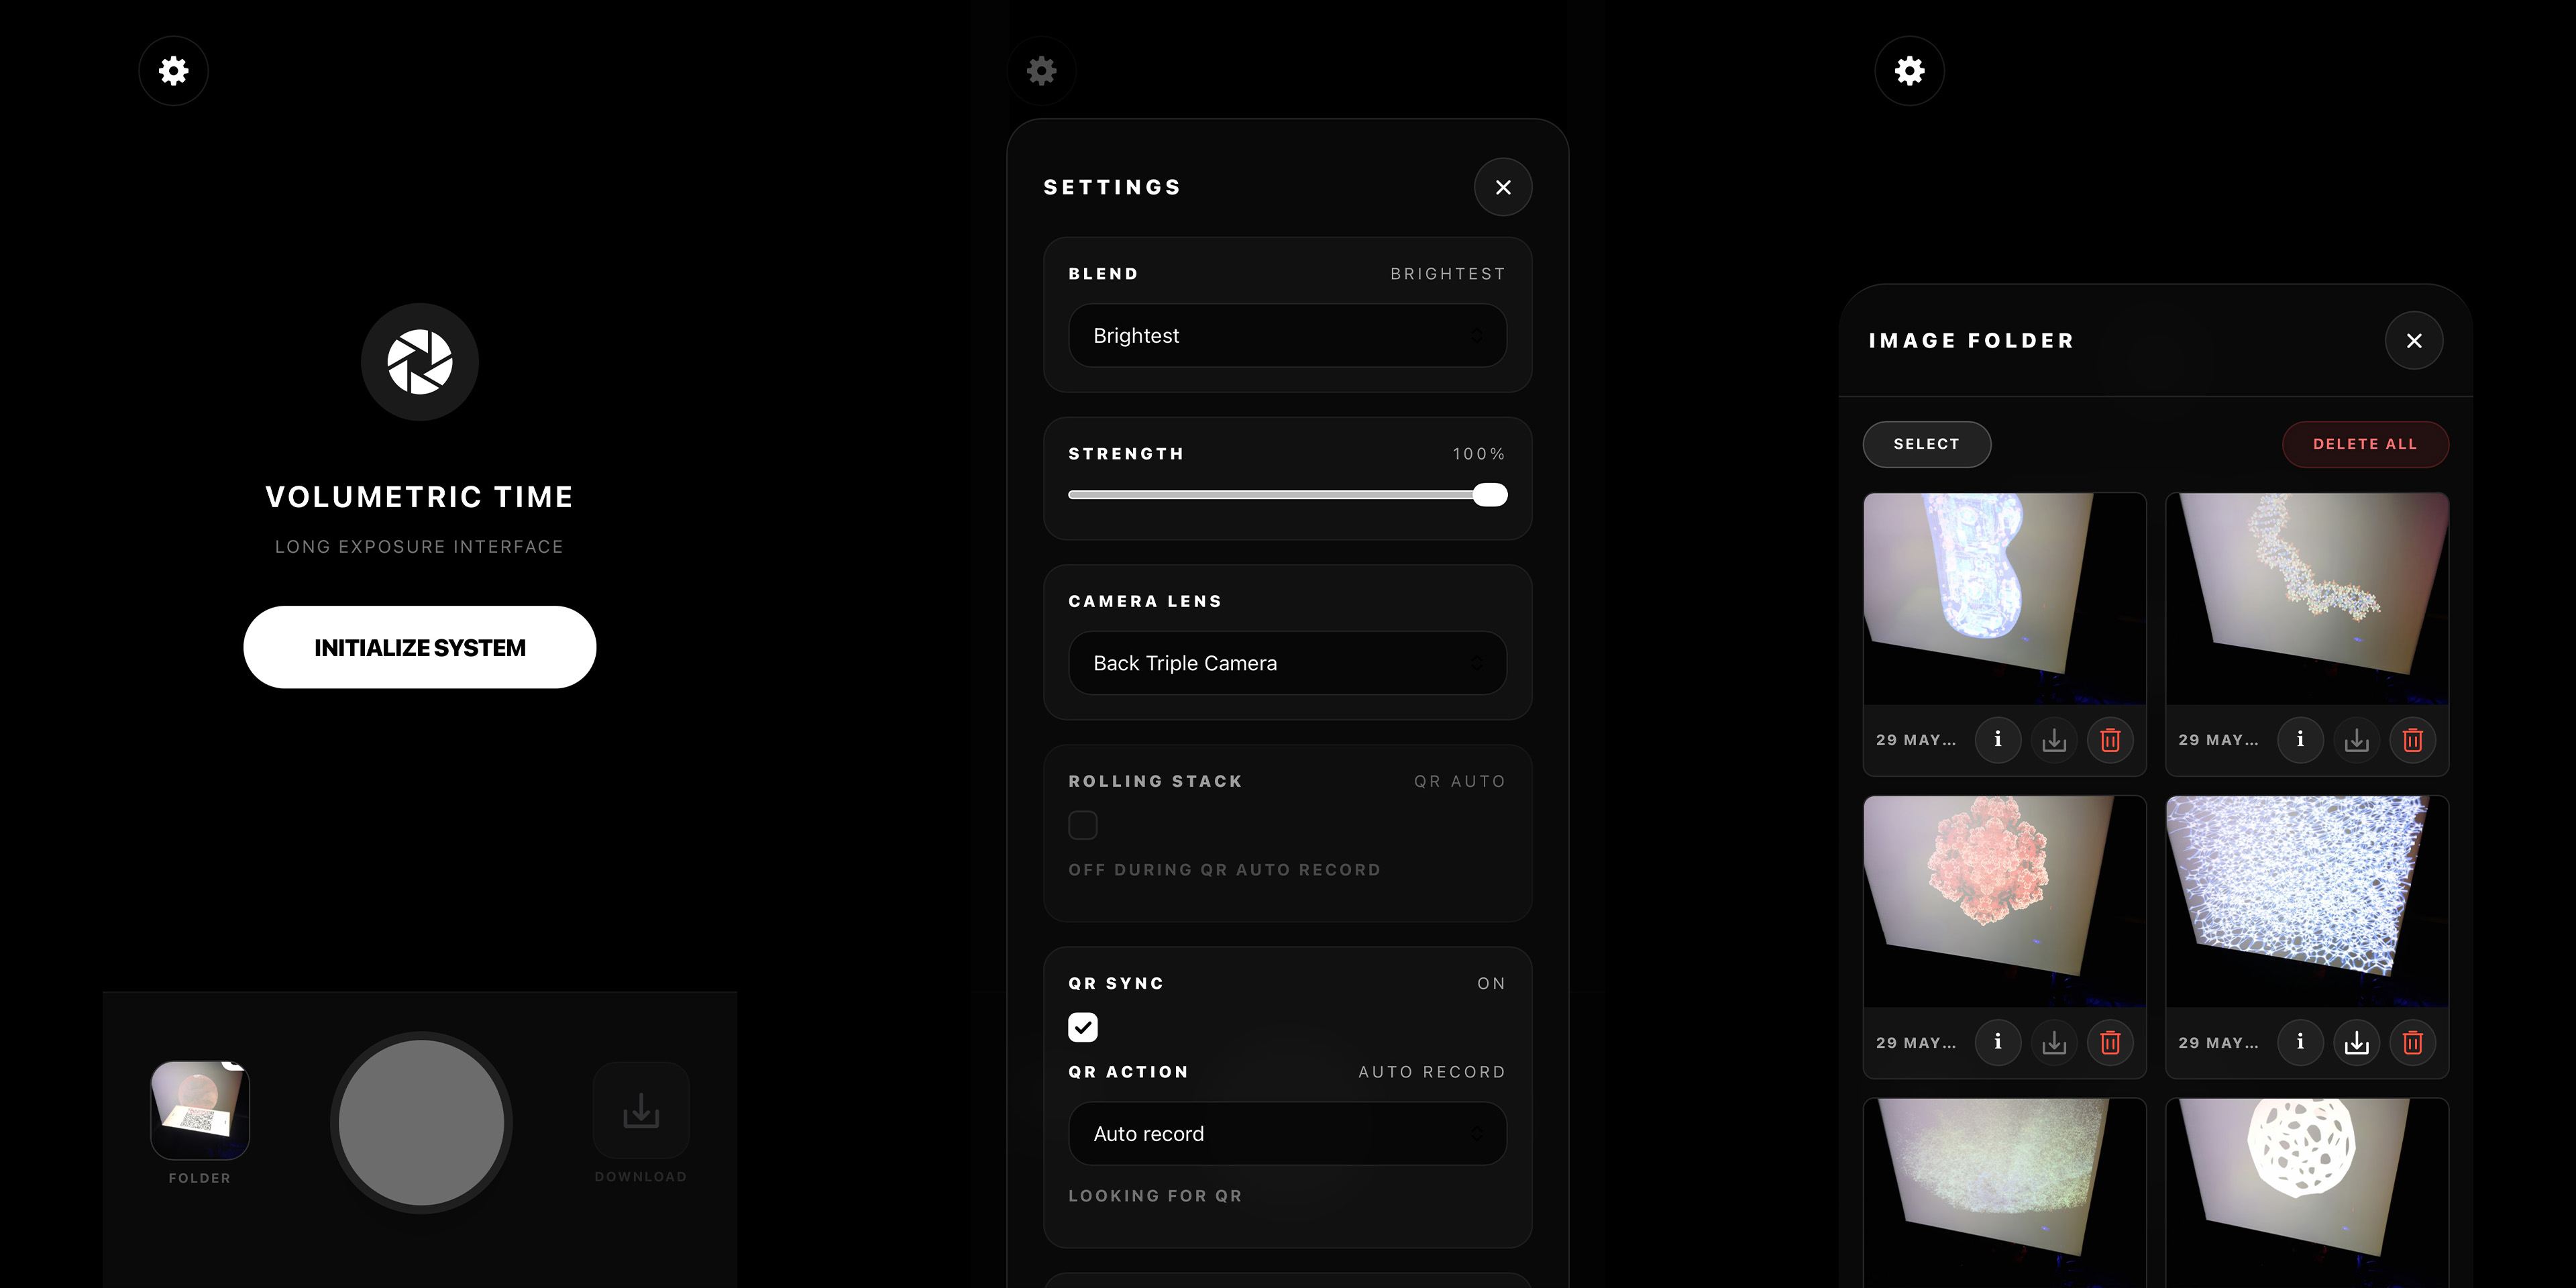
There is also a “rolling stack” mode, which continuously records and stacks the frames, but removes the oldest frames from the stack after a set amount of time. This is an alternative to showing the QR code on the screen.
The app cannot reliably save captures directly to the phone’s photo library without user interaction. Instead, it stores them in the app’s local storage up to a set limit. Once that limit is reached, it overwrites the oldest saved photo. In the image folder, users can click the download button on the photo they want to save, which opens the option to save it to their gallery.
Controller
The Raspberry Pi runs the main control program for the installation. The main program is a Python script that starts a local web server. This server provides a controller interface, a display page for the monitor, access to the media files, and the control commands for the actuator.
I made the controller browser-based so I could change settings, view the current system state, and start sequences from my phone without connecting a mouse and keyboard to the Raspberry Pi.
The controller interface is also a PWA, so I can install it on my phone like a small control app. A stop button remains visible at the bottom of the screen at all times. At the top, there is another section that shows the current position and information about the current state and the next scheduled action. Between these fixed sections are scrollable settings with expandable and collapsible subsections.
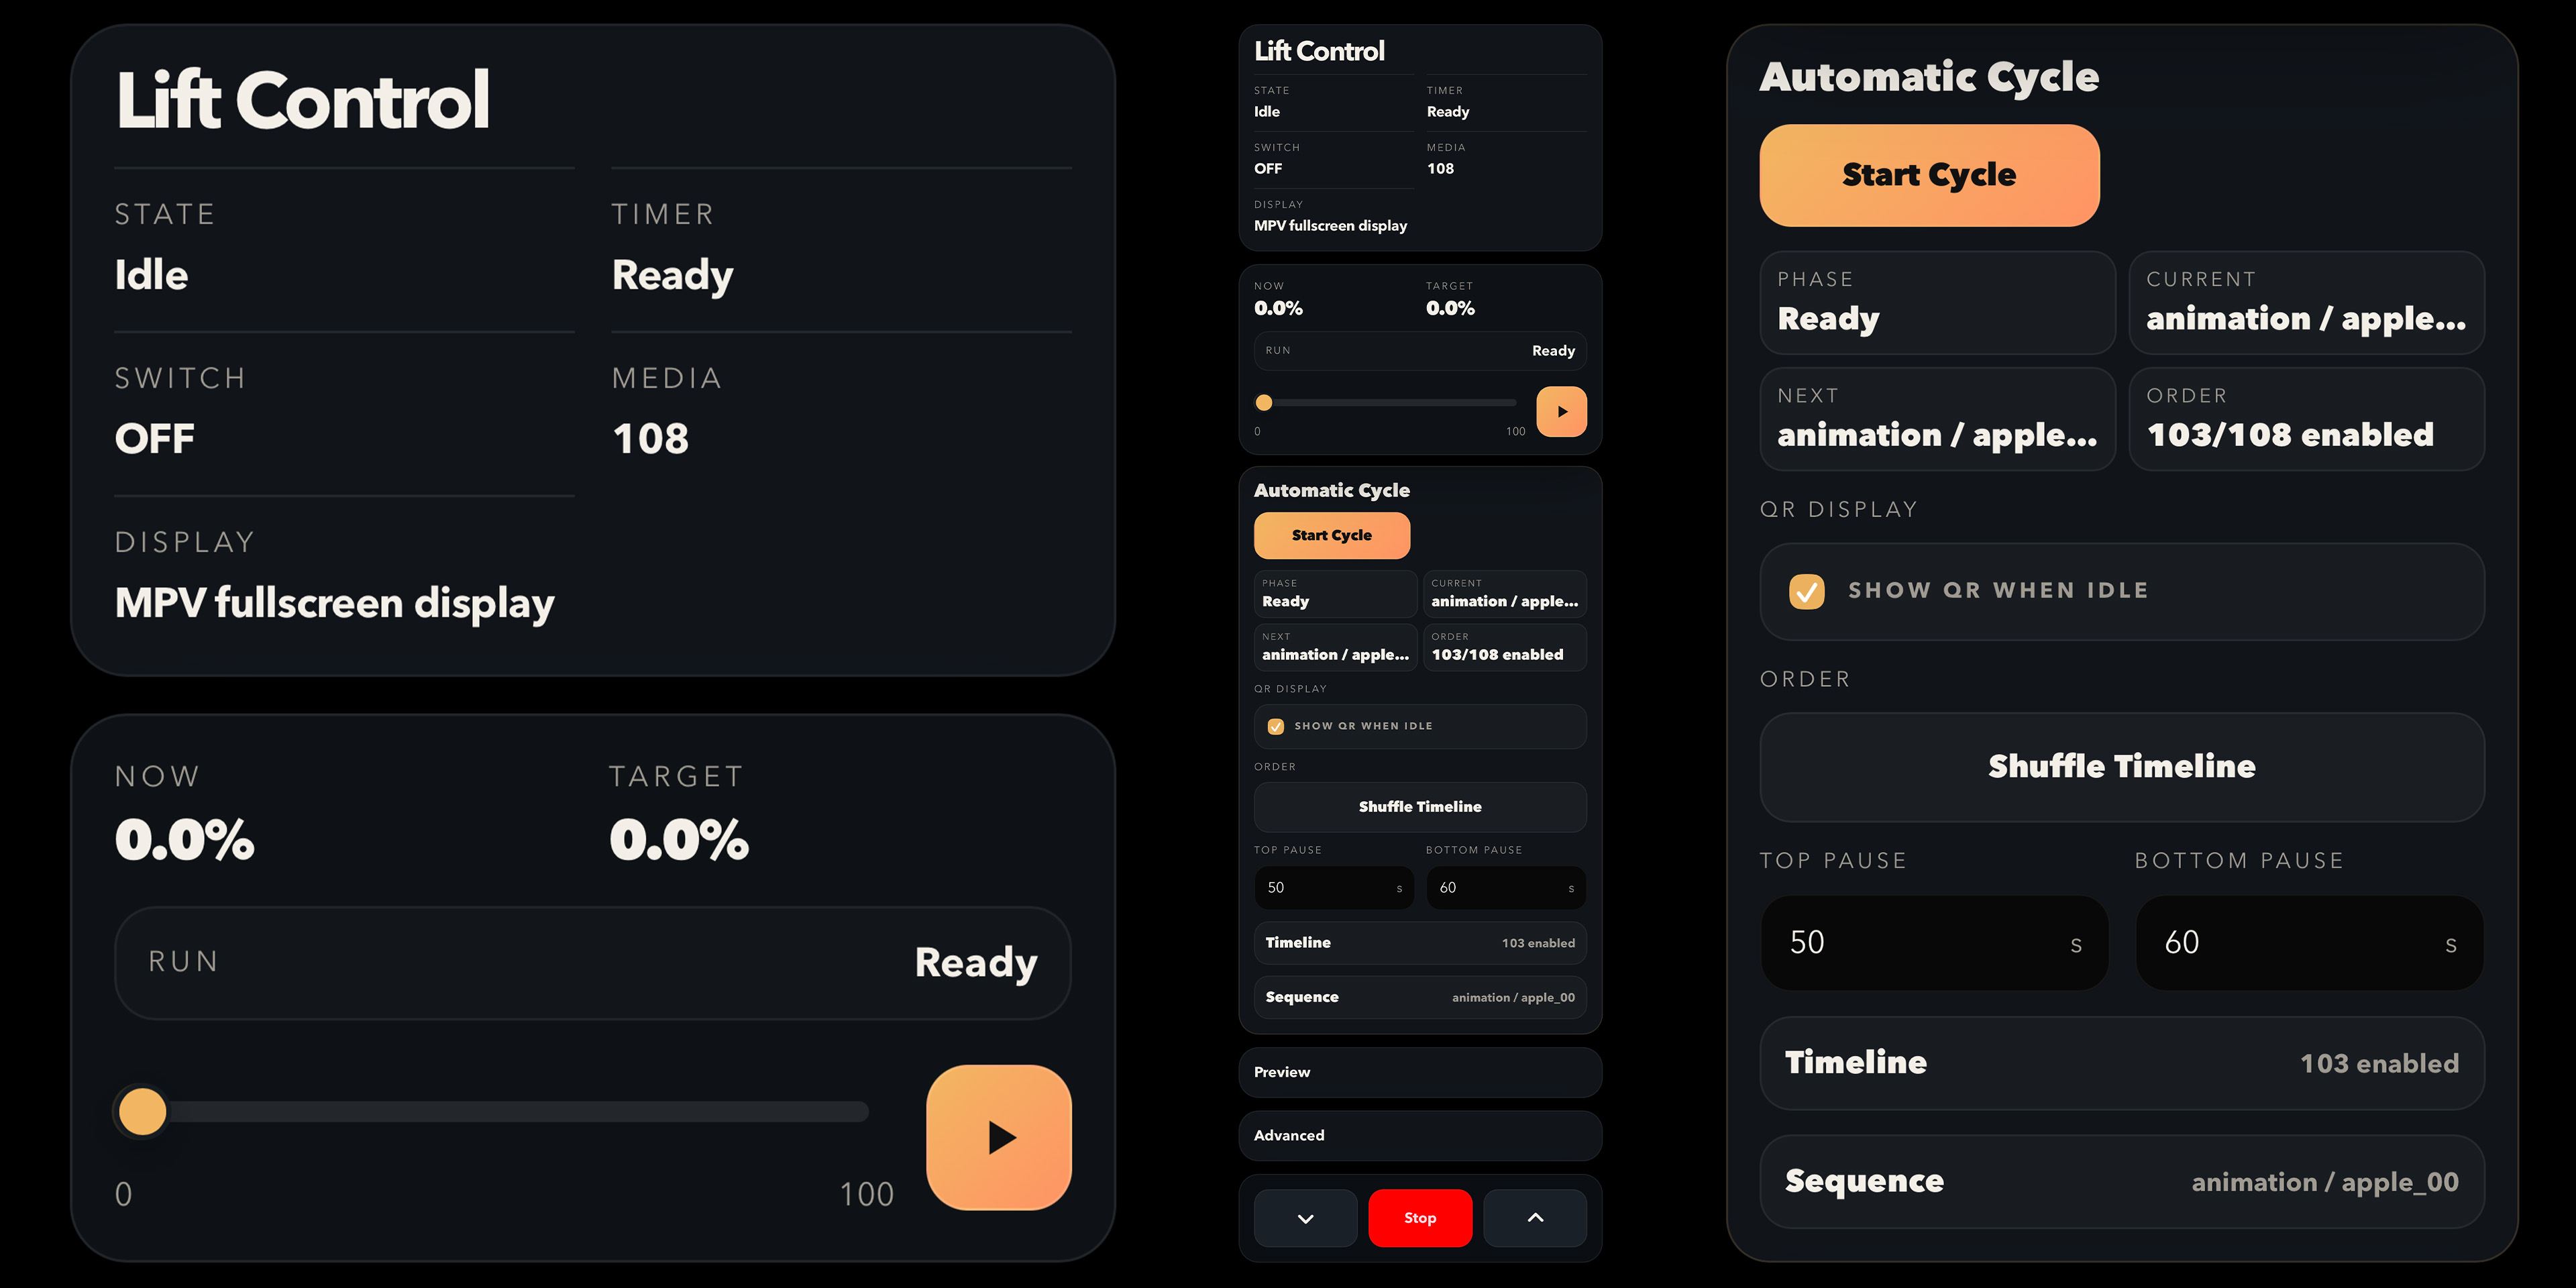
The actuator is controlled through the Raspberry Pi’s GPIO pins, which are connected to the H-bridge motor driver. The software uses separate pins for extending and retracting the actuator and generates a PWM signal to control the movement. Because the actuator doesn’t provide exact position feedback, the program estimates the current lift position from calibrated movement times. I measured how long the lift takes to travel through its full stroke and used this to convert the movement time into a percentage of the 48 cm stroke length the monitor can travel. I slightly overestimate the travel duration so the actuator reliably reaches its limit switch and can recalibrate its position at the end of each movement. However, when it is turned off while not being in the bottom home position, it needs an extra cycle to return to normal automatically. It can also be manually driven back to the default position with the physical switch or through the controller, where I also included a homing button.
When the lift moves upward or downward, the software selects the matching image frame or video position, so the monitor becomes the moving slice it displays.
The media library is organized through a media folder on the Raspberry Pi. Both video files and image sequences can be put in the media folder or into subfolders to organize them by category. I mainly use folders with individual image sequences, because they can be played forwards and backwards more smoothly than pre-rendered videos and have fewer compression artifacts.
I also added an optional sequence.json file, which can set the position where the sequence starts and how tall it should be, so a sequence does not always have to use the full 48 cm stroke. An optional preview image can also be added to the folder, which shows up in the controller next to the corresponding sequence.
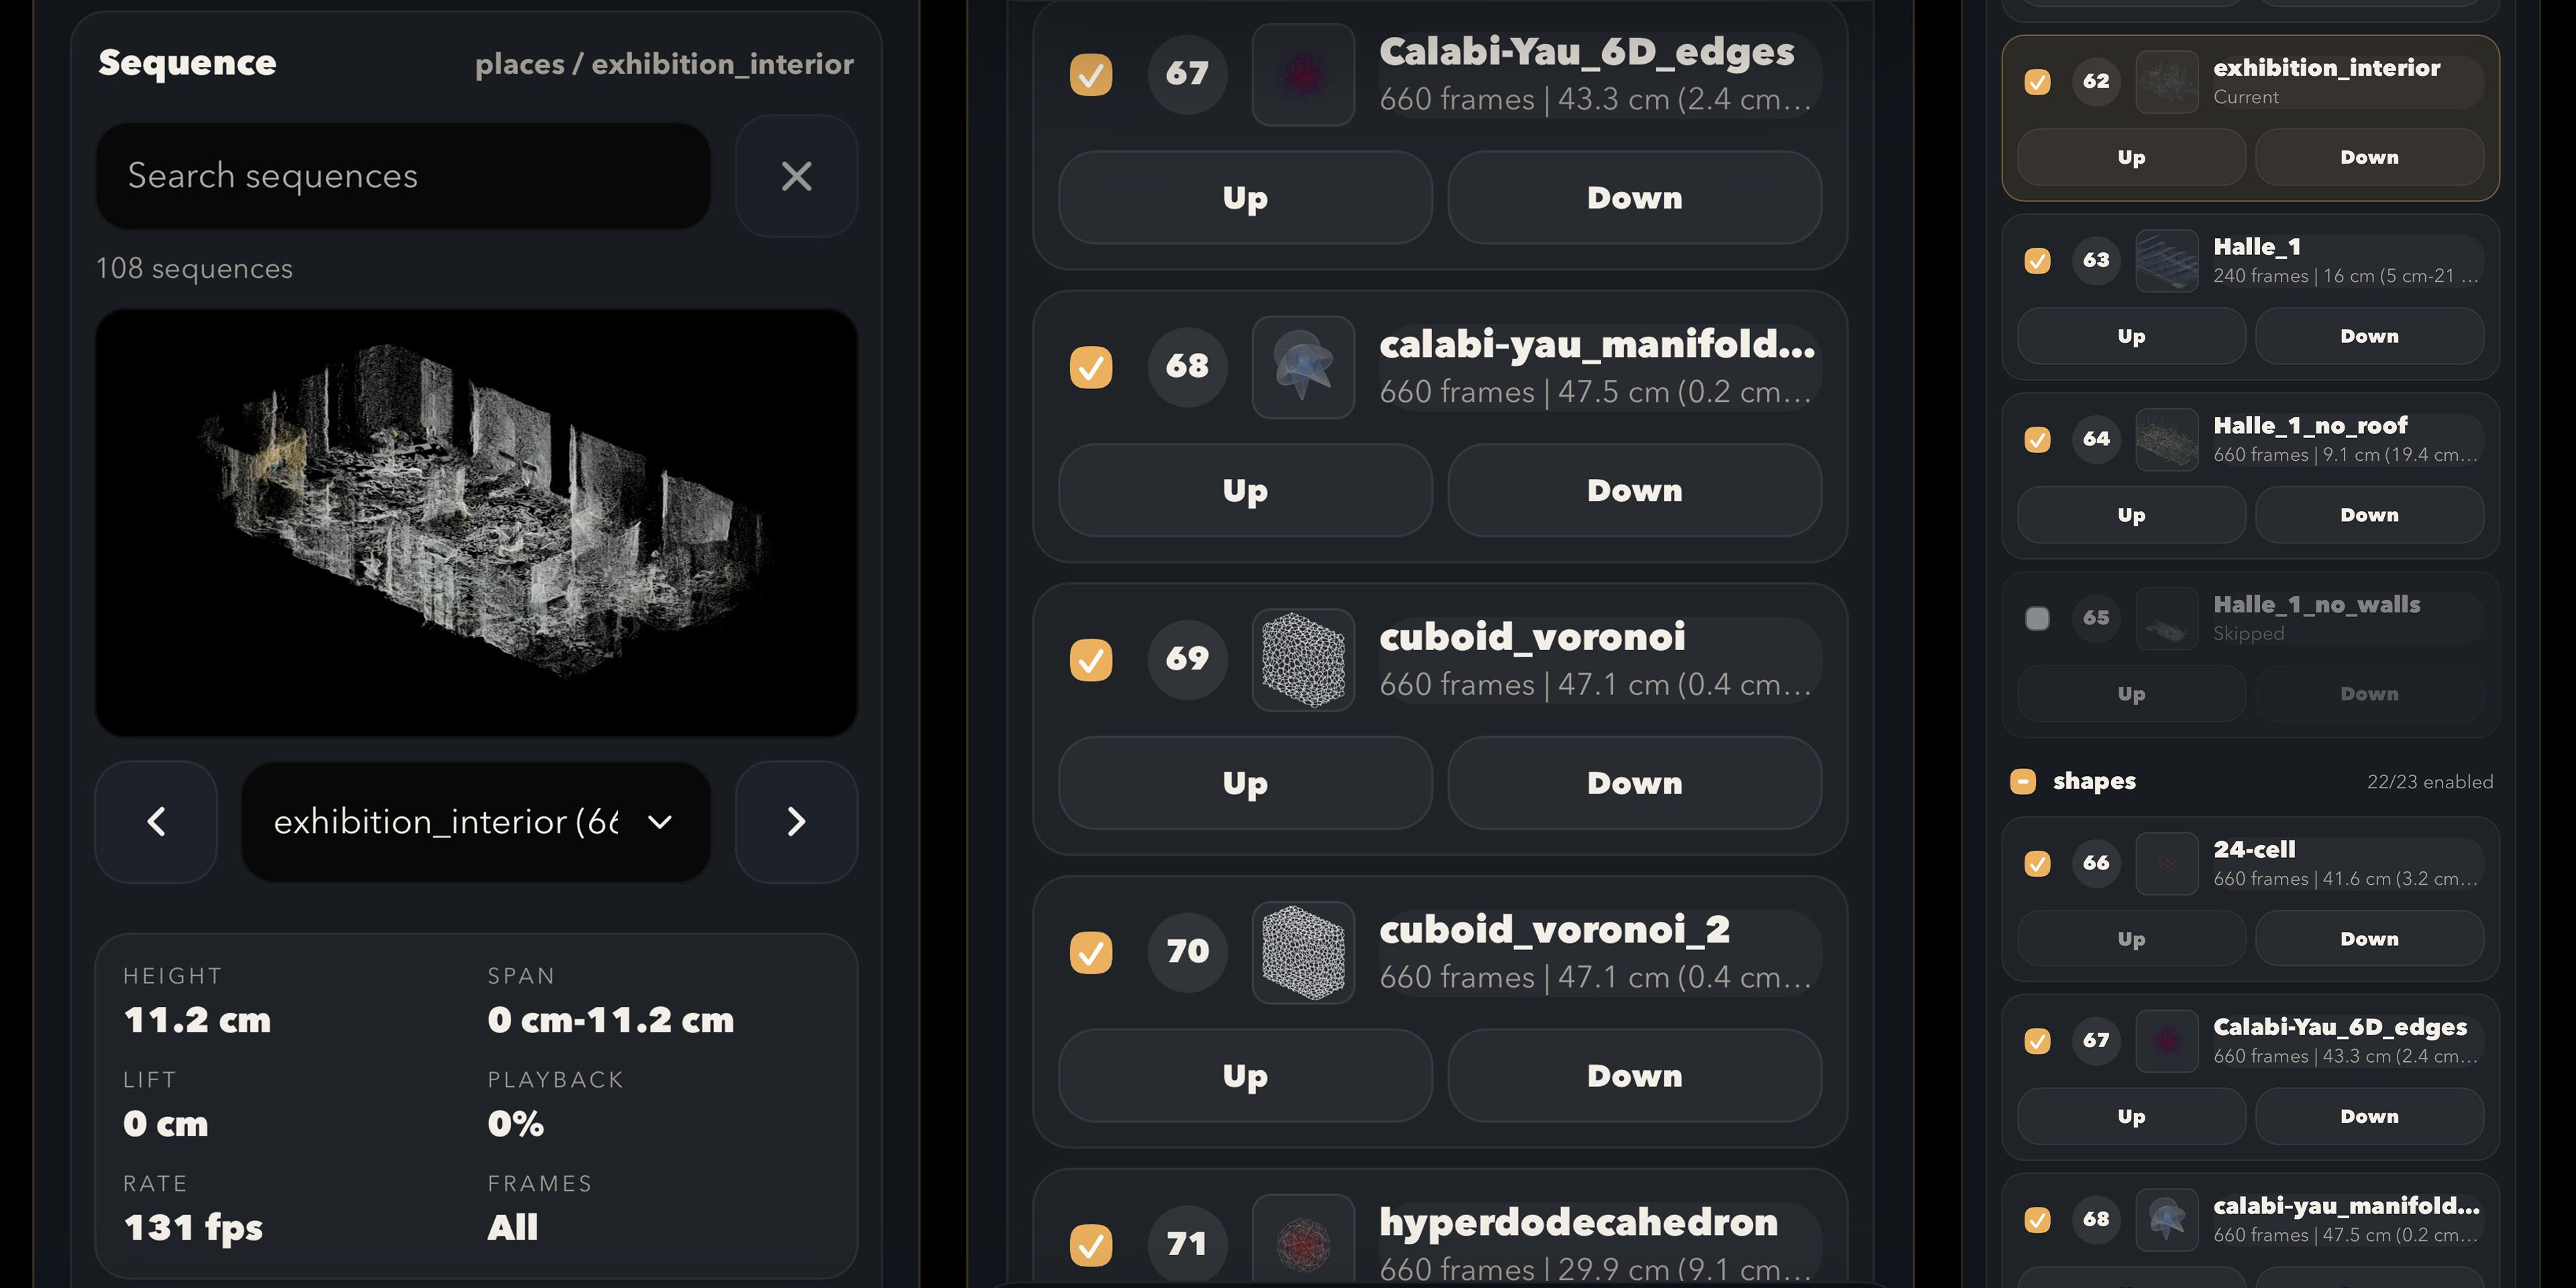
For the installation, I added an automatic cycle mode. In this mode, the Raspberry Pi can loop through a list of selected sequences without manual control. It moves the lift up and down, waits for a set pause at the top and bottom, and then continues with the next sequence. I added pauses to show the QR code and so visitors can look at their captured image, but also to prevent the actuator from overheating and to reduce the amount of noise during the installation. For cycle mode, the controller can also set the sequence order, disable individual sequences, and adjust timing settings.
The program also generates the QR codes used to synchronize the visitors’ camera apps. During pauses between sequences, the monitor can show a QR code that opens the camera app and contains timing information for the next recording. To avoid the QR code appearing in the long-exposure result, the software switches to a black screen for a few seconds before and after the movement. I use the MPV open-source media player software as the display mode because it is well-suited for full-screen playback on the Raspberry Pi.
I also added startup scripts for installation use. The system can be started with a launcher script, and a boot service can start the control server automatically after the Raspberry Pi boots. That way, the whole installation can be turned on with one power switch. The full-screen display is started later through the desktop session, because the graphical environment needs to be ready before MPV can open properly.
3D Model Slicer
To display 3D objects with this tool, I needed to convert 3D objects into frame sequences, because doing this in real-time would be too computationally intensive on the Raspberry Pi, and I wanted to show as many frames as possible during the motion to get a smooth volume.
For this, I made a browser-based 3D slicer. The tool can load different 3D model formats and display them in a preview scene. To position the objects precisely, I added several view modes, including a regular 3D view, an orthographic top-down view to see the slices as they will be exported, and front and side views. The model can be moved, rotated, scaled, flipped, and cropped before exporting.
The main function of the slicer is to move a virtual slicing plane through the model and render the result as a sequence of images. These frames later correspond to different physical heights of the moving monitor. I added different rendering styles, such as solid mesh, point cloud, and Gaussian splatting rendering. The solid mesh worked best for single color objects and objects that I wanted to be filled. To get the texture of objects, I converted them into a point cloud, so that each point is colored with the texture color at its position. The Gaussian splatting mode was more of an experiment to see how well these overlapping, translucent ellipsoids would work in my setup.
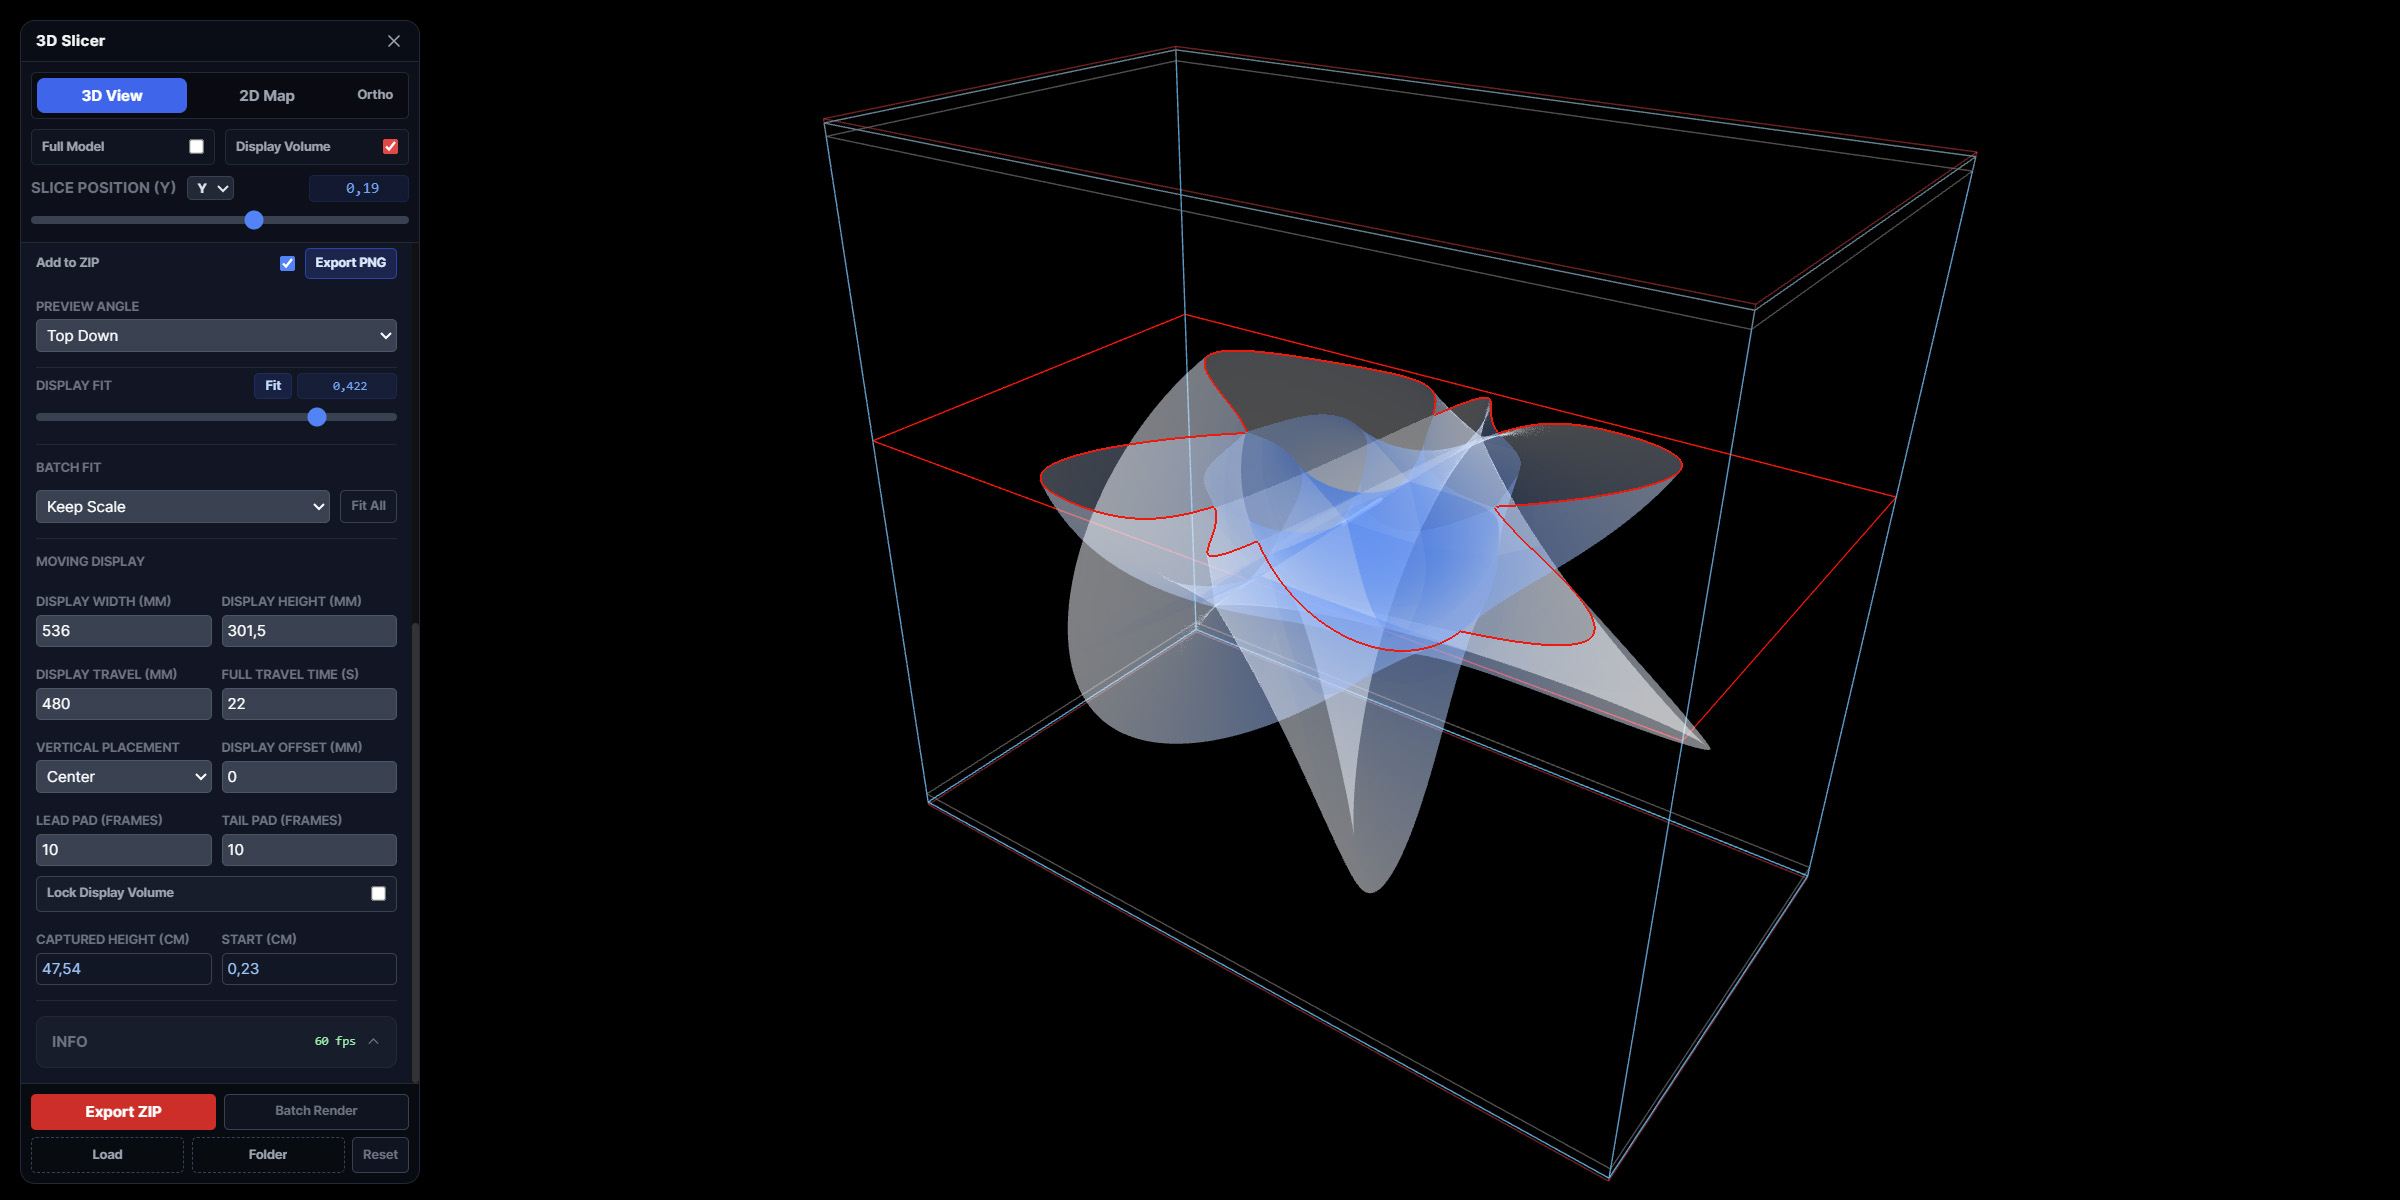
The tool includes settings for the width and height of the monitor, the travel distance of the lift, and the time required for one lift movement. These values are used to calculate how many frames need to be exported and how the virtual model fits into the physical movement range. This allowed me to export frame sequences at the correct physical scale and generate a matching sequence.json file. The slicer can also directly generate a preview.png for the controller. I also included a visual guide, showing the display volume as a cuboid, the slice position, and the 3D model size within that volume.
Visualizer
I also made a visualizer that loads an existing sequence and stacks its frames vertically, matching the way the moving monitor would reconstruct it in space. With this tool, I could see what the volume could look like, create previews, and adjust settings.
The visualizer loads an image sequence, video, and existing JSON metadata and reconstructs the frames as a stack in a 3D scene. The program uses Three.js and WebGL, so I can rotate around the stack, switch to an orthographic view, and look at the volume from above.
The tool is calibrated to the real dimensions of the installation. In the code, the display volume is represented as a 536 mm × 301.5 mm × 480 mm cuboid, within which the frames are stacked.
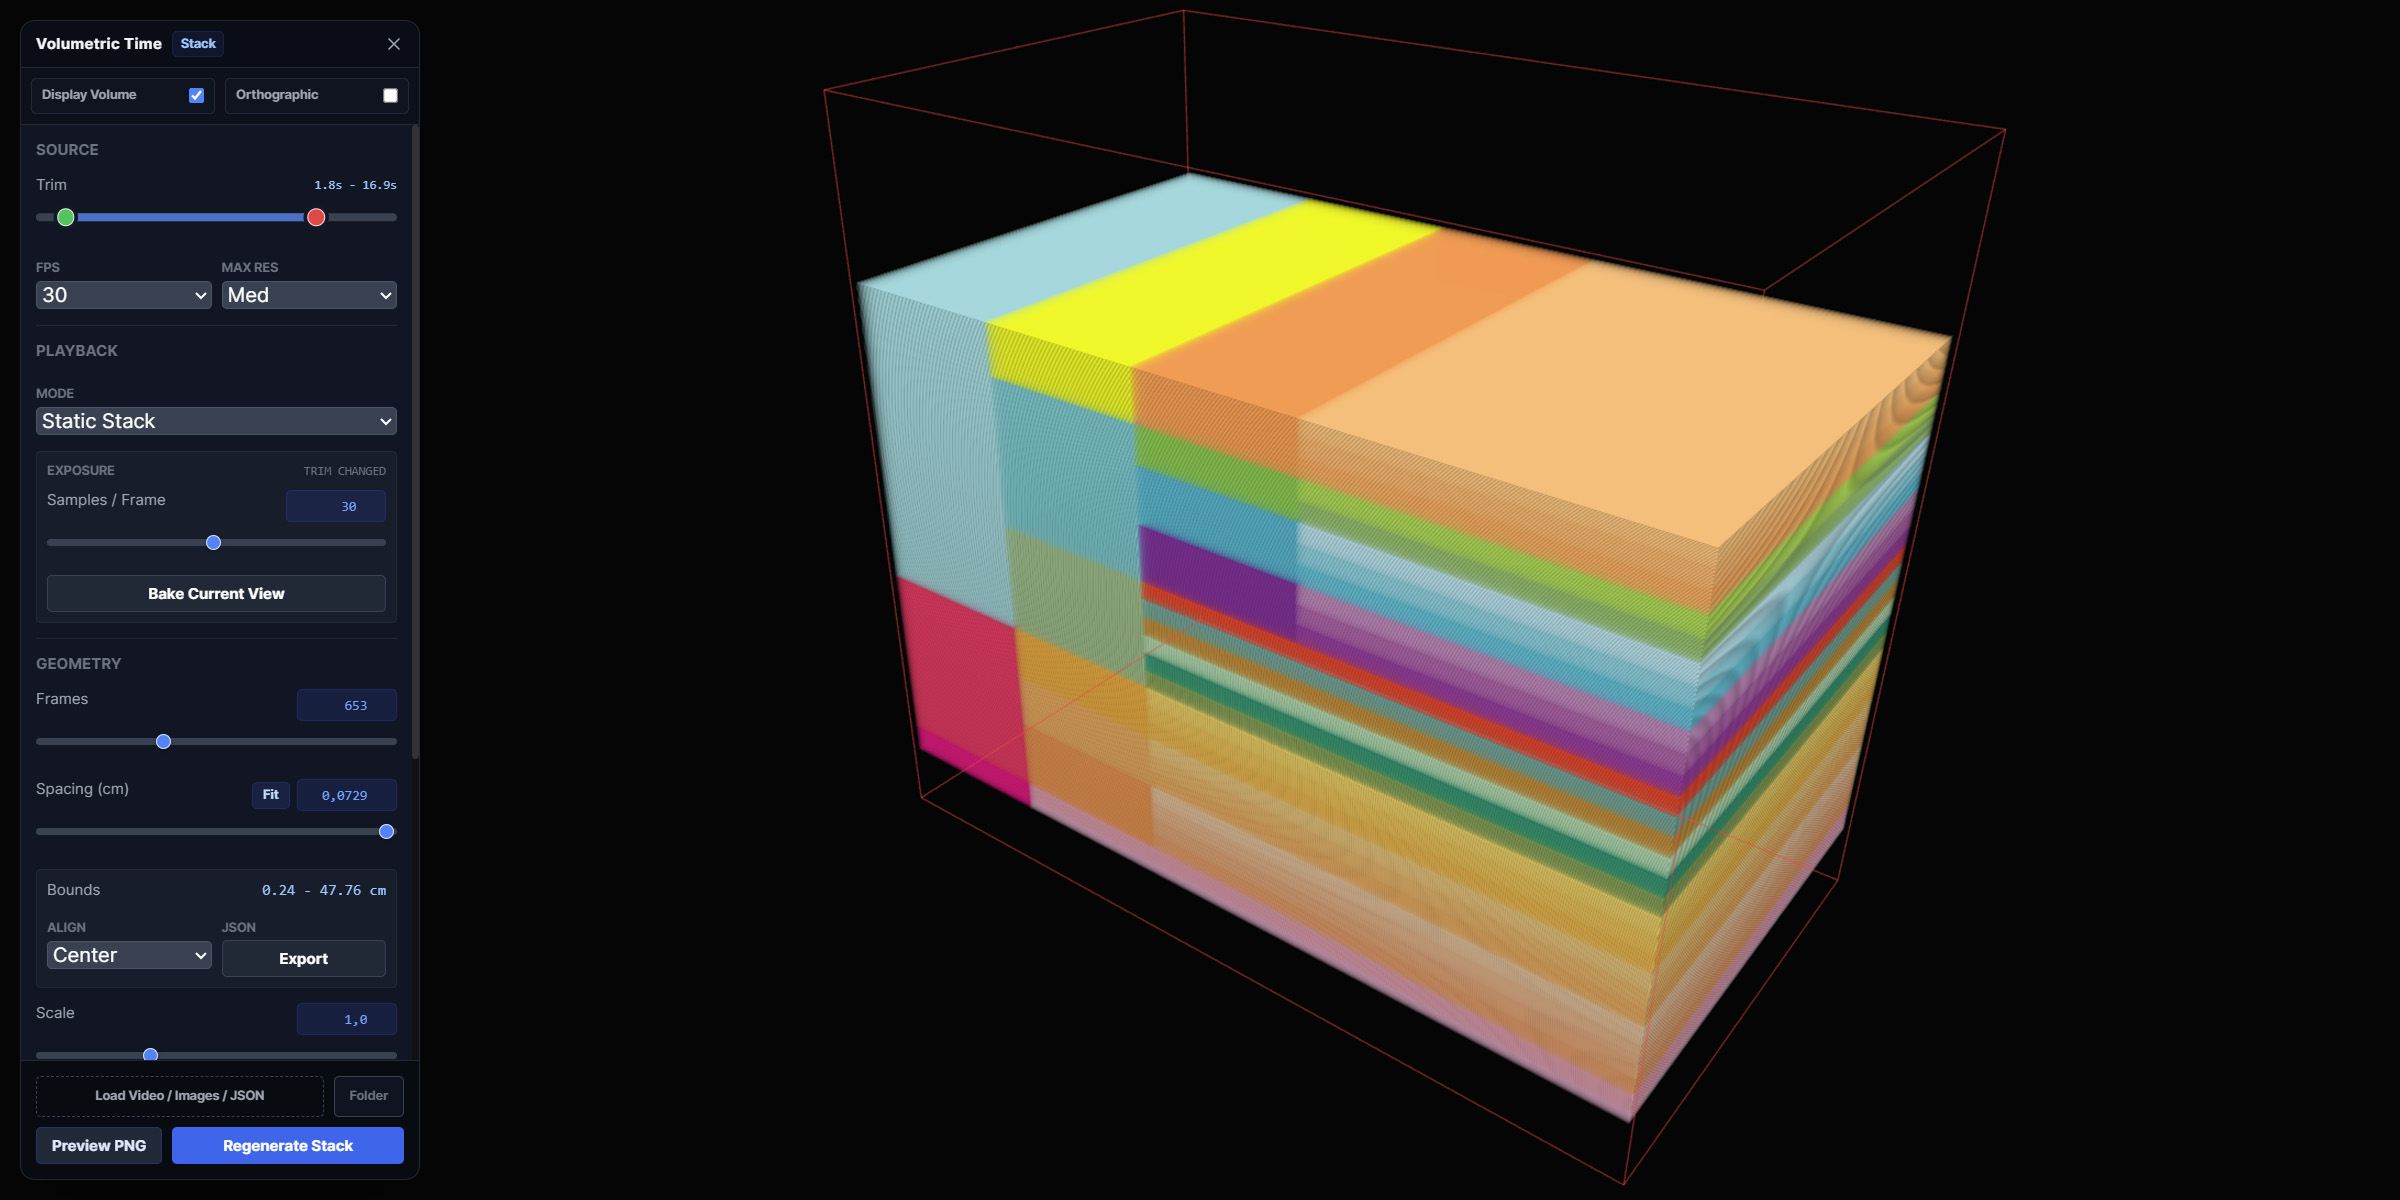
The visualizer has several playback modes. In the static stack mode, all frames are shown together as a transparent volume. In the scanning slice mode, only the current slice moves through the volume, which is closer to how the installation works in real time. The progressive build mode shows how the volume accumulates over time, which is useful for imagining what the image in the long-exposure camera app will look like. The scanning slice mode also has a viewport trail option that can simulate a long exposure by not drawing a background. This only works as long as the virtual camera isn’t moved. I can experiment with different speeds and enable “smooth motion,” which interpolates the slice movement between frames and visually fills the gaps.
To adjust existing sequences more precisely, I added controls for their geometry. The frame count, spacing between frames, scale, alignment (center or bottom), and start height can be changed inside the visualizer. I mainly needed this for sequences that weren’t created with the 3D slicer program and didn’t have height information, such as various CT scans and videos. The visualizer can export these settings as JSON metadata, so the Raspberry Pi program can later use the same placement information when playing the sequence. For these kinds of sequences, I could also generate the preview images for the controller. Rendering controls made it possible to experiment with opacity, darkest and brightest pixel cutoff, and blending modes.
Instead of using the installation for only one type of image, I treated it as a platform for different kinds of spatial and temporal data. I grouped the content into several categories: mathematical shapes, scanned objects, scanned spaces, scientific datasets, CT scans, and time-based video experiments. Each category tested a different way of translating information into a volume.
Shapes
I wanted to show some basic shapes and objects to convey the principles of the process. I added the famous Utah-teapot as an example 3D object to test the setup. I prepared simple shapes such as cubes, spheres, and pyramids, but they felt too plain on their own. To make the slices and movement more visually interesting, I converted some of them into Voronoi structures.
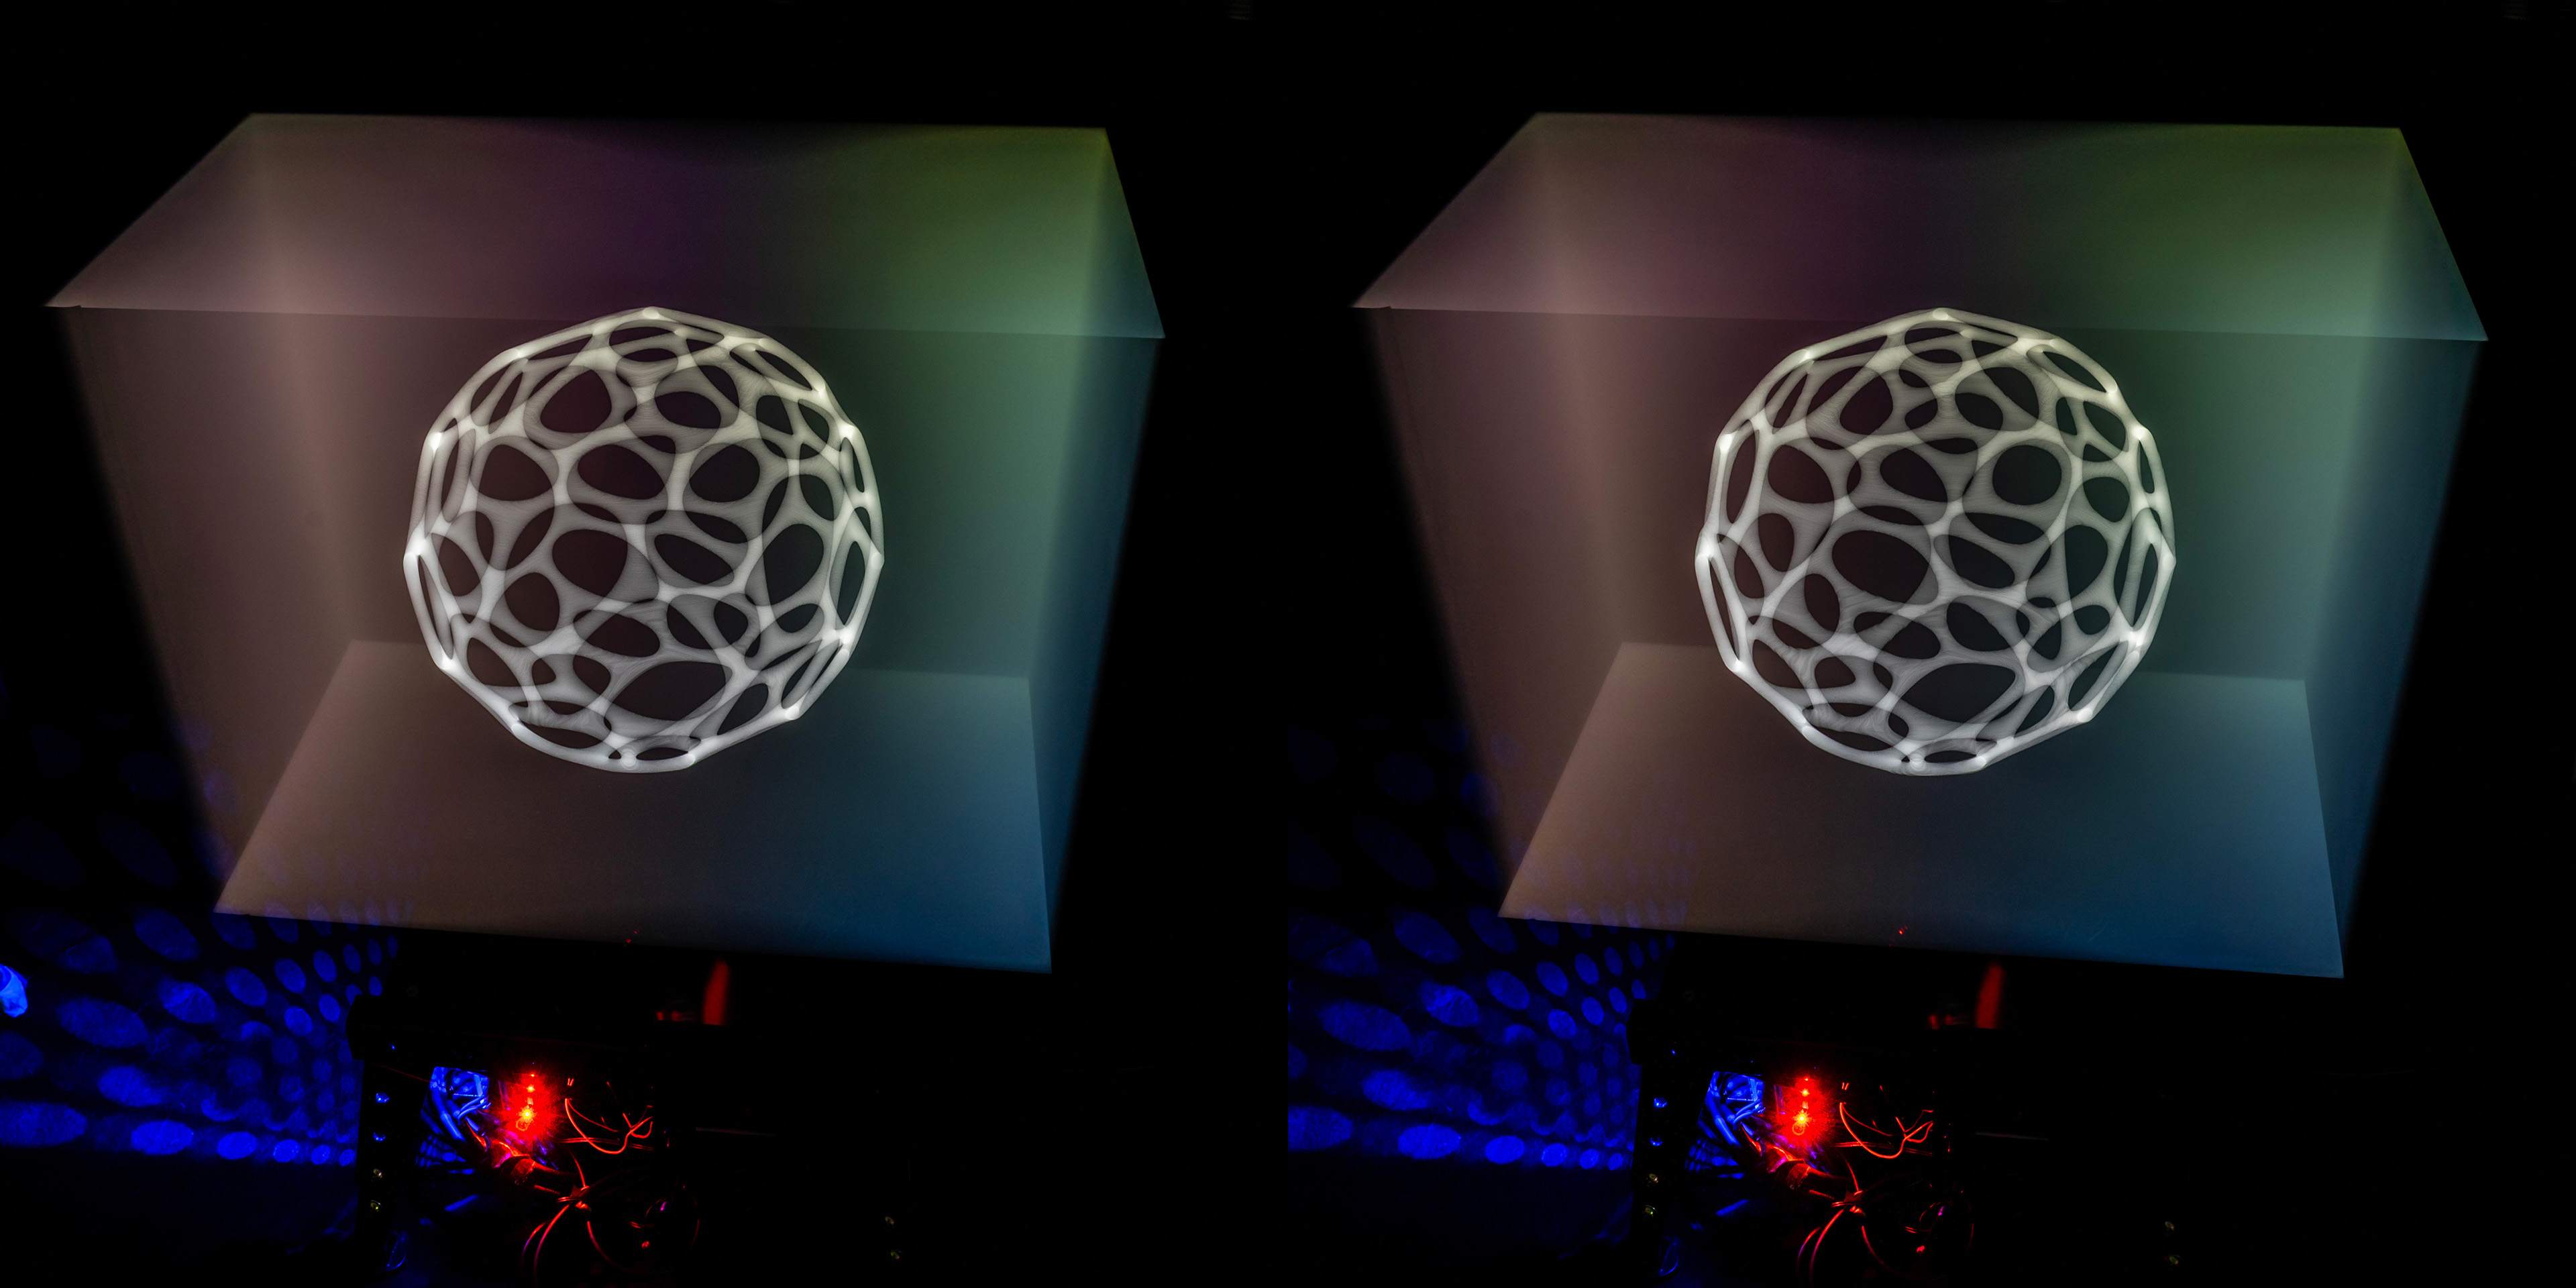
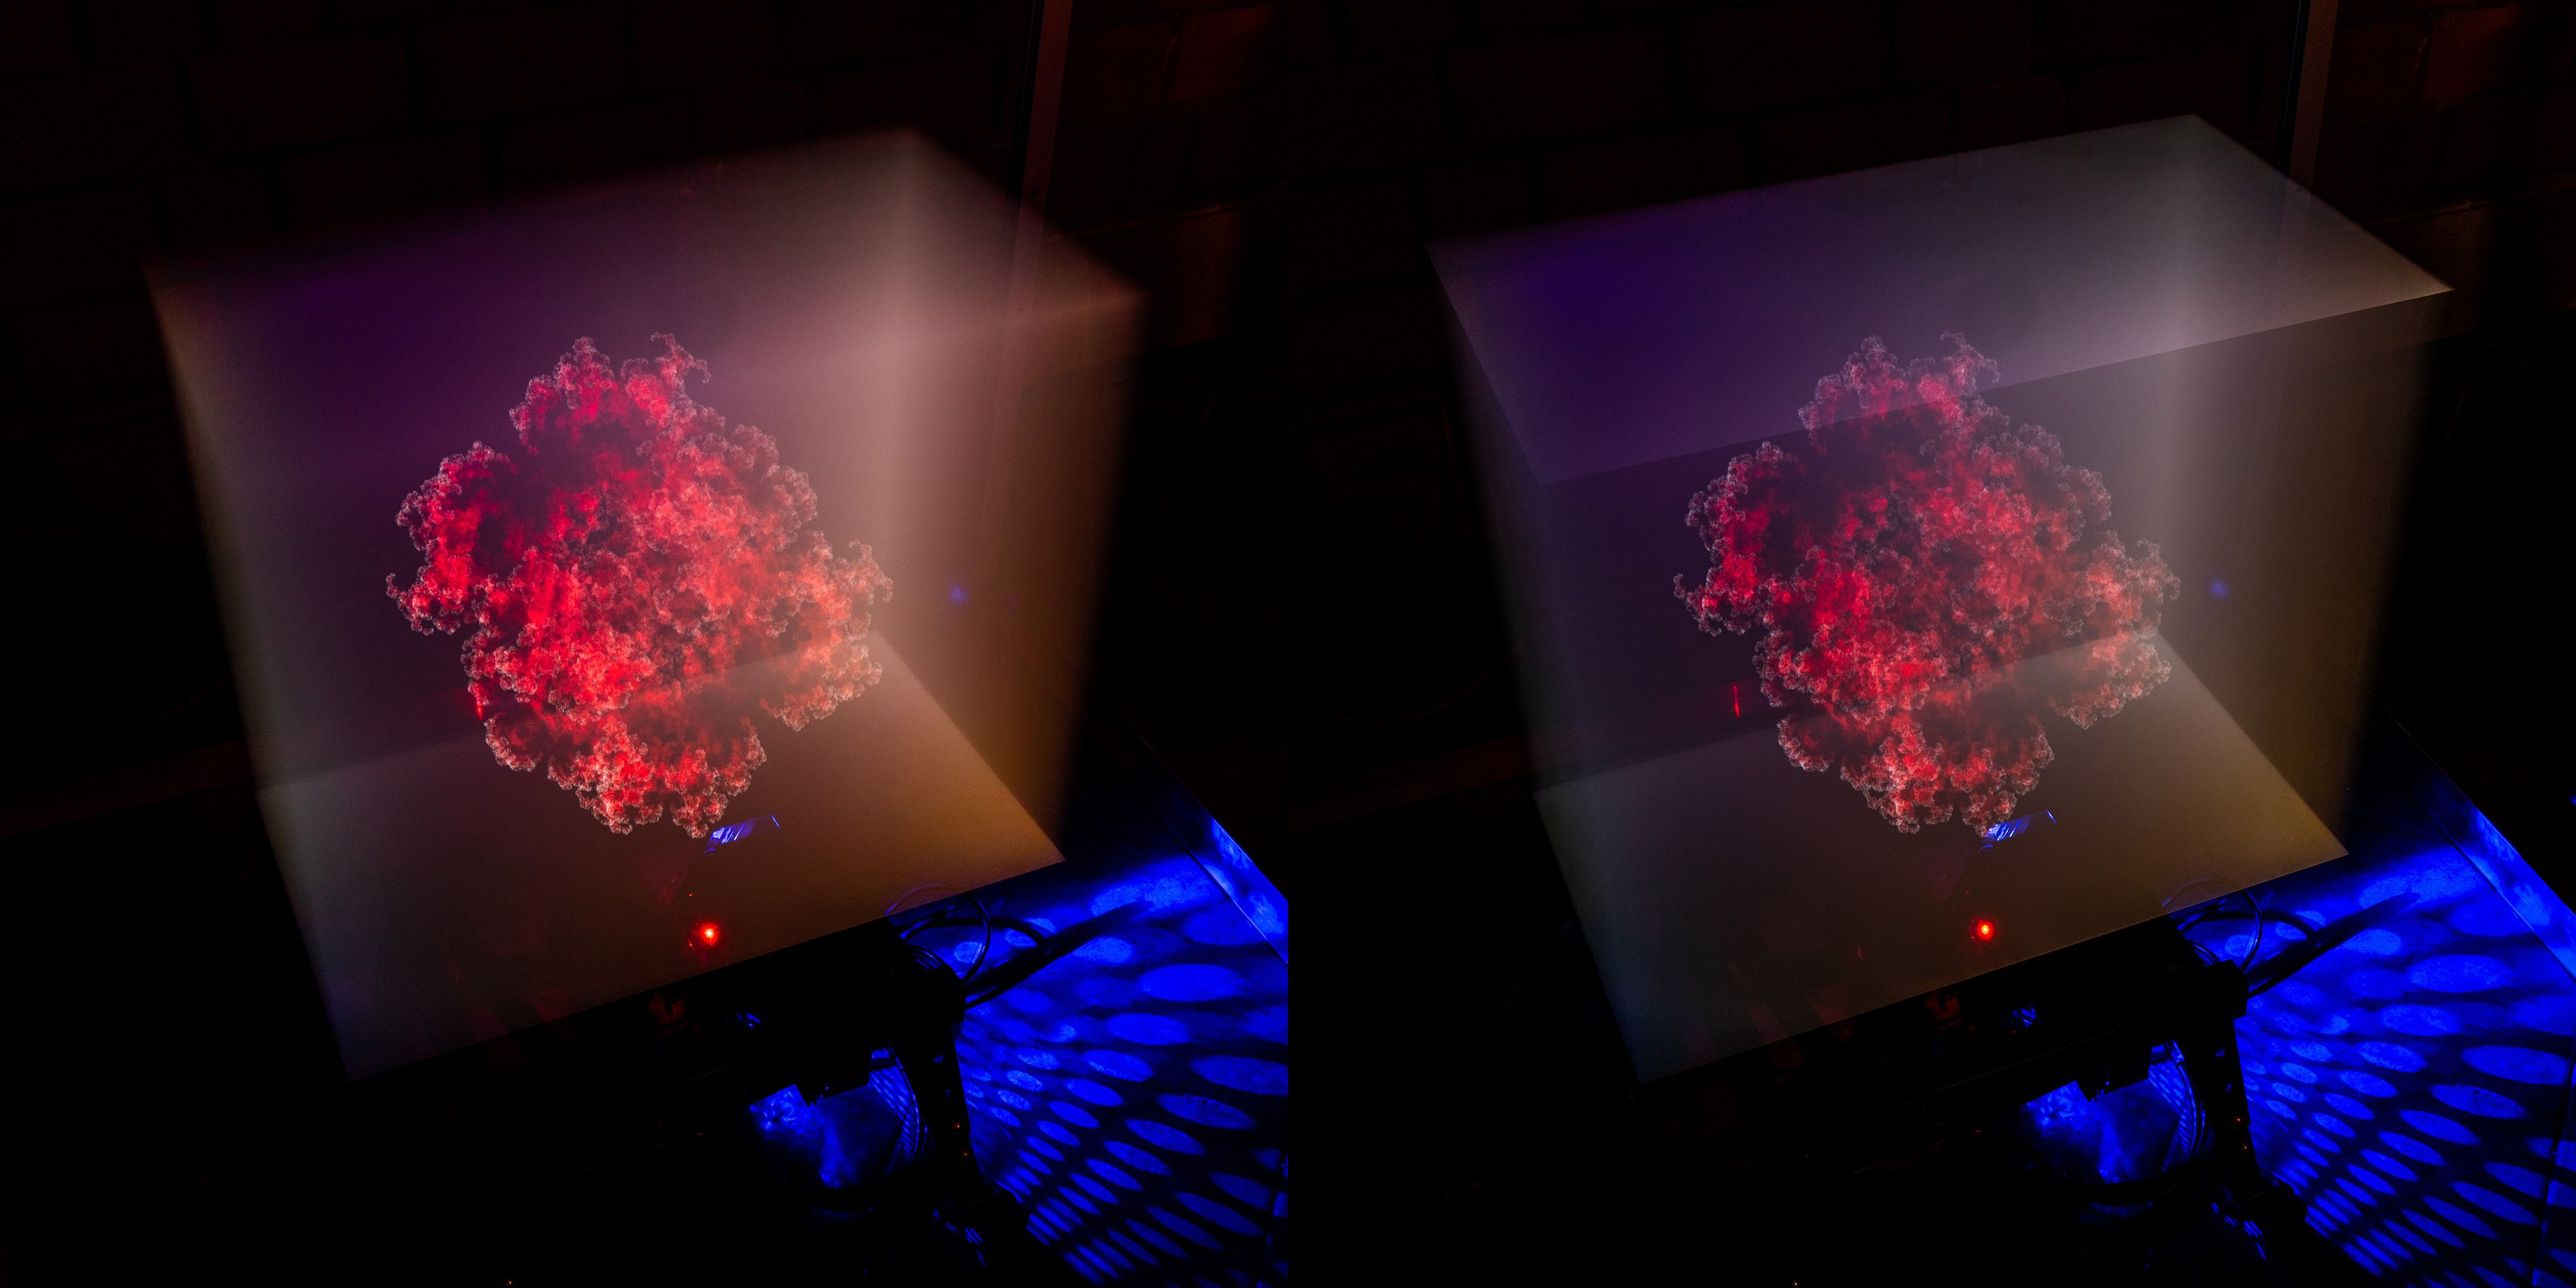
I also generated some more complex, fractal shapes that are difficult to fully grasp in normal renders because their outer structures occlude their interiors. For example, I added a Sierpiński Pyramid, a Menger sponge, a Mandelbulb and Julia set, and KIFS fractals (Kaleidoscopic Iterated Function System).
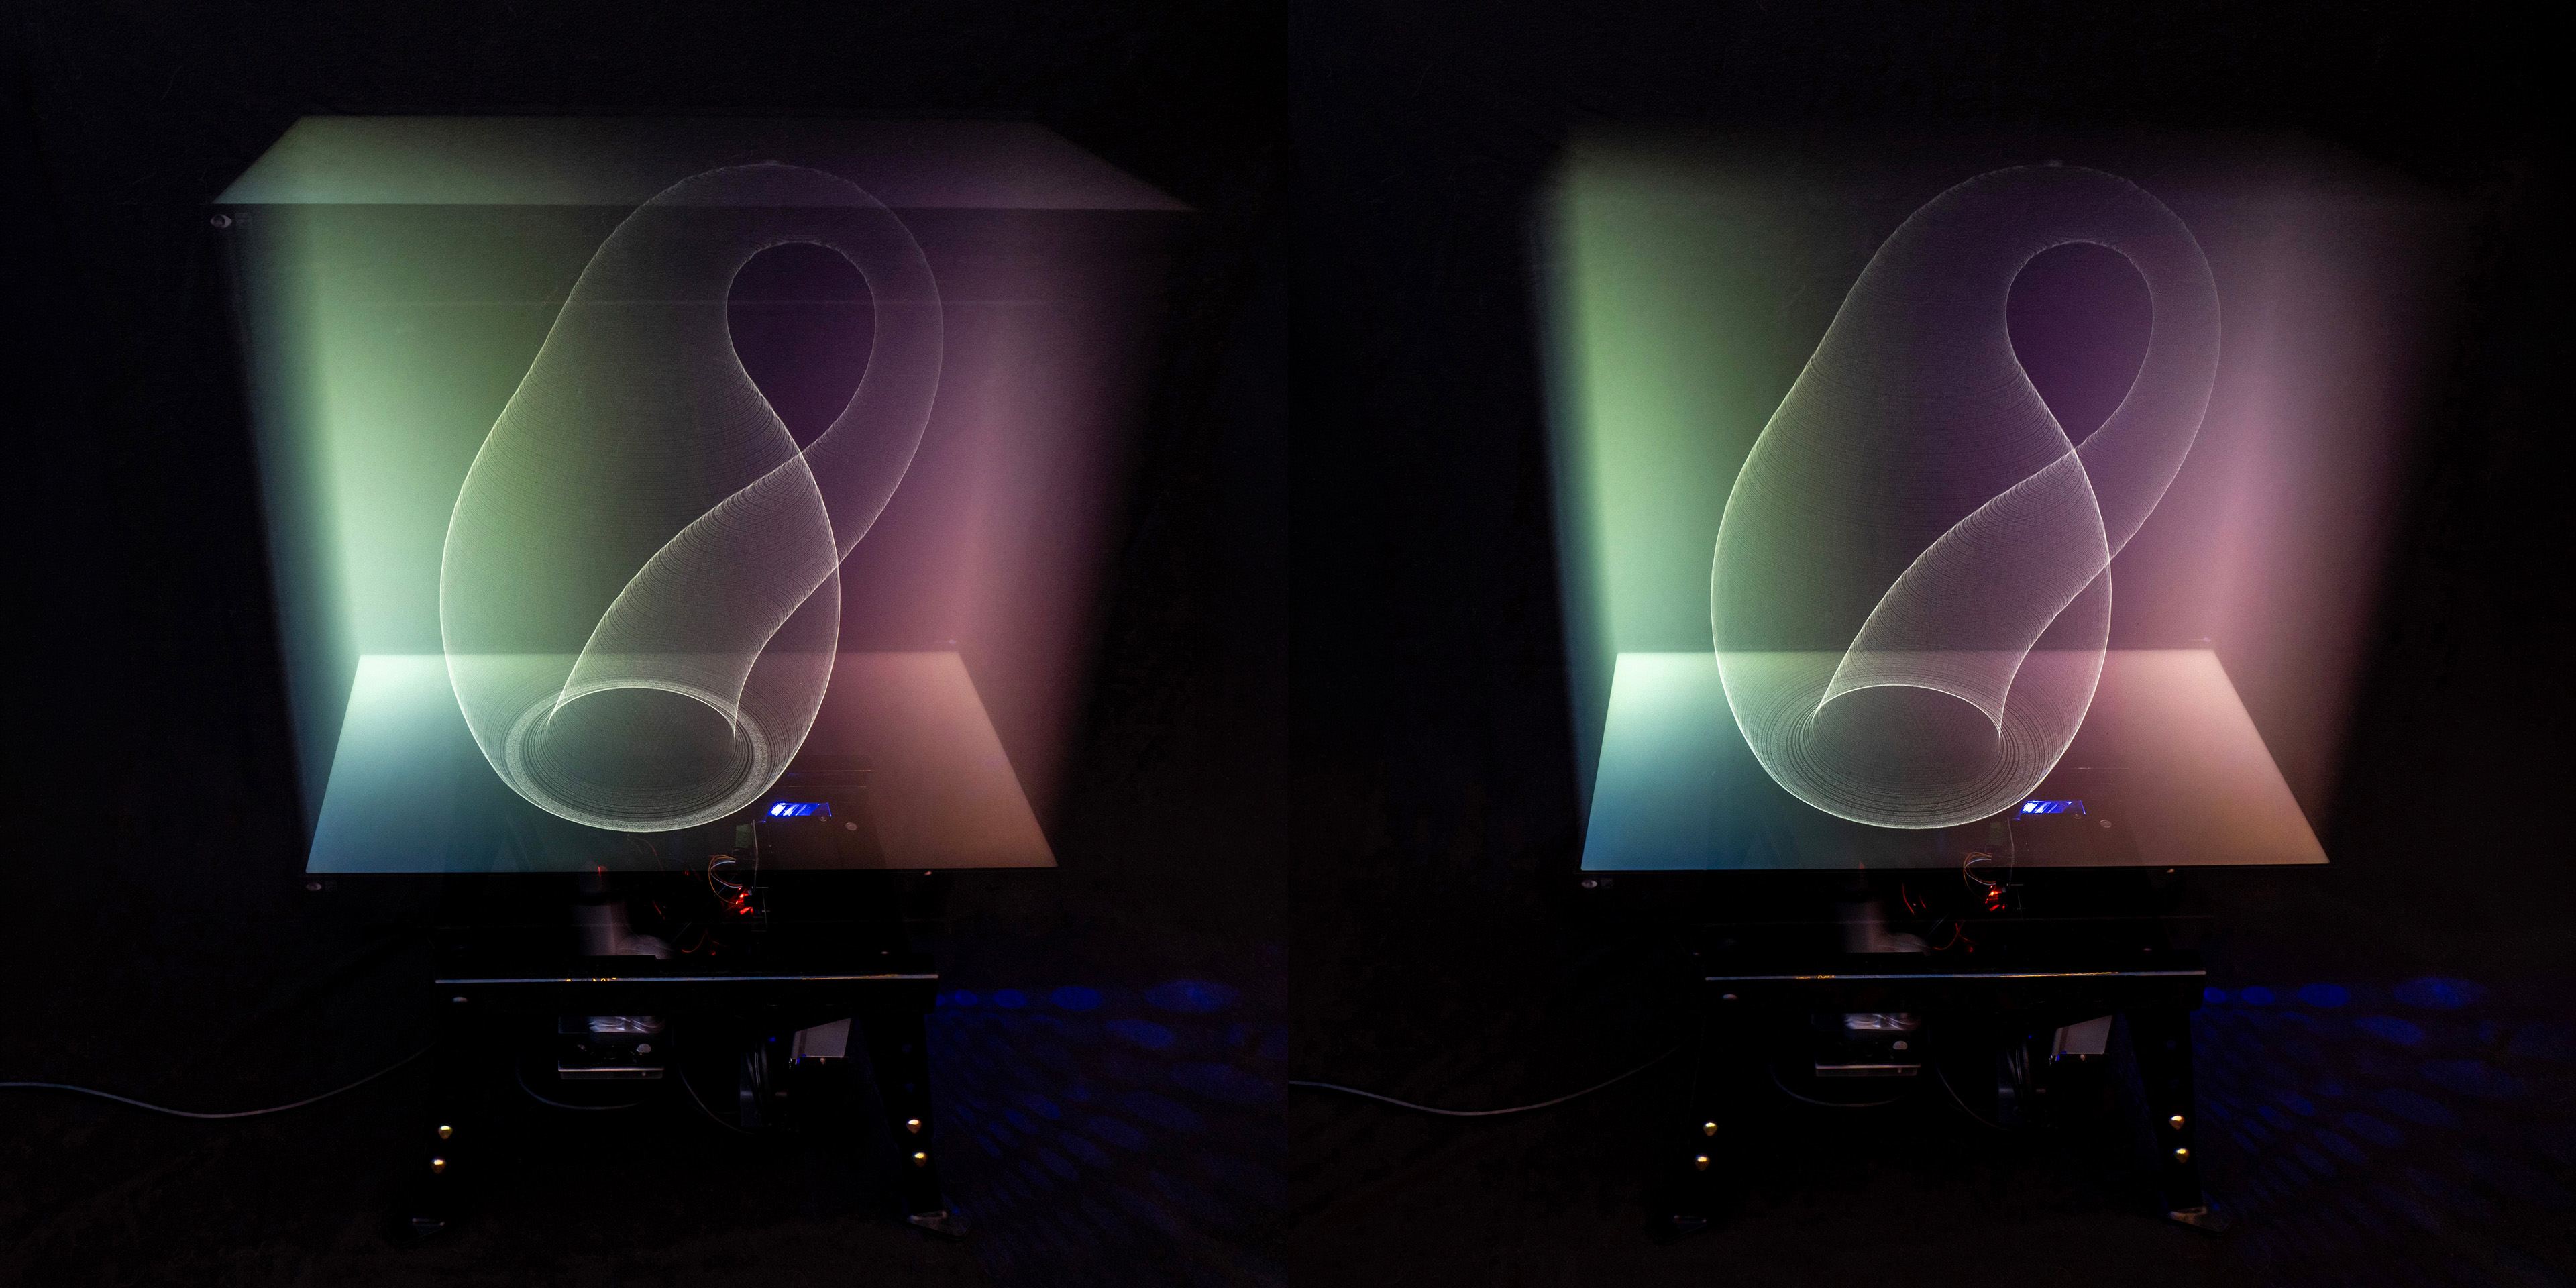
I wanted to play with different dimensions because of the way this display uses time and space to turn 2D images into 3D. I added a simple one-sided Möbius loop, torus knots, and the one-sided Klein bottle.
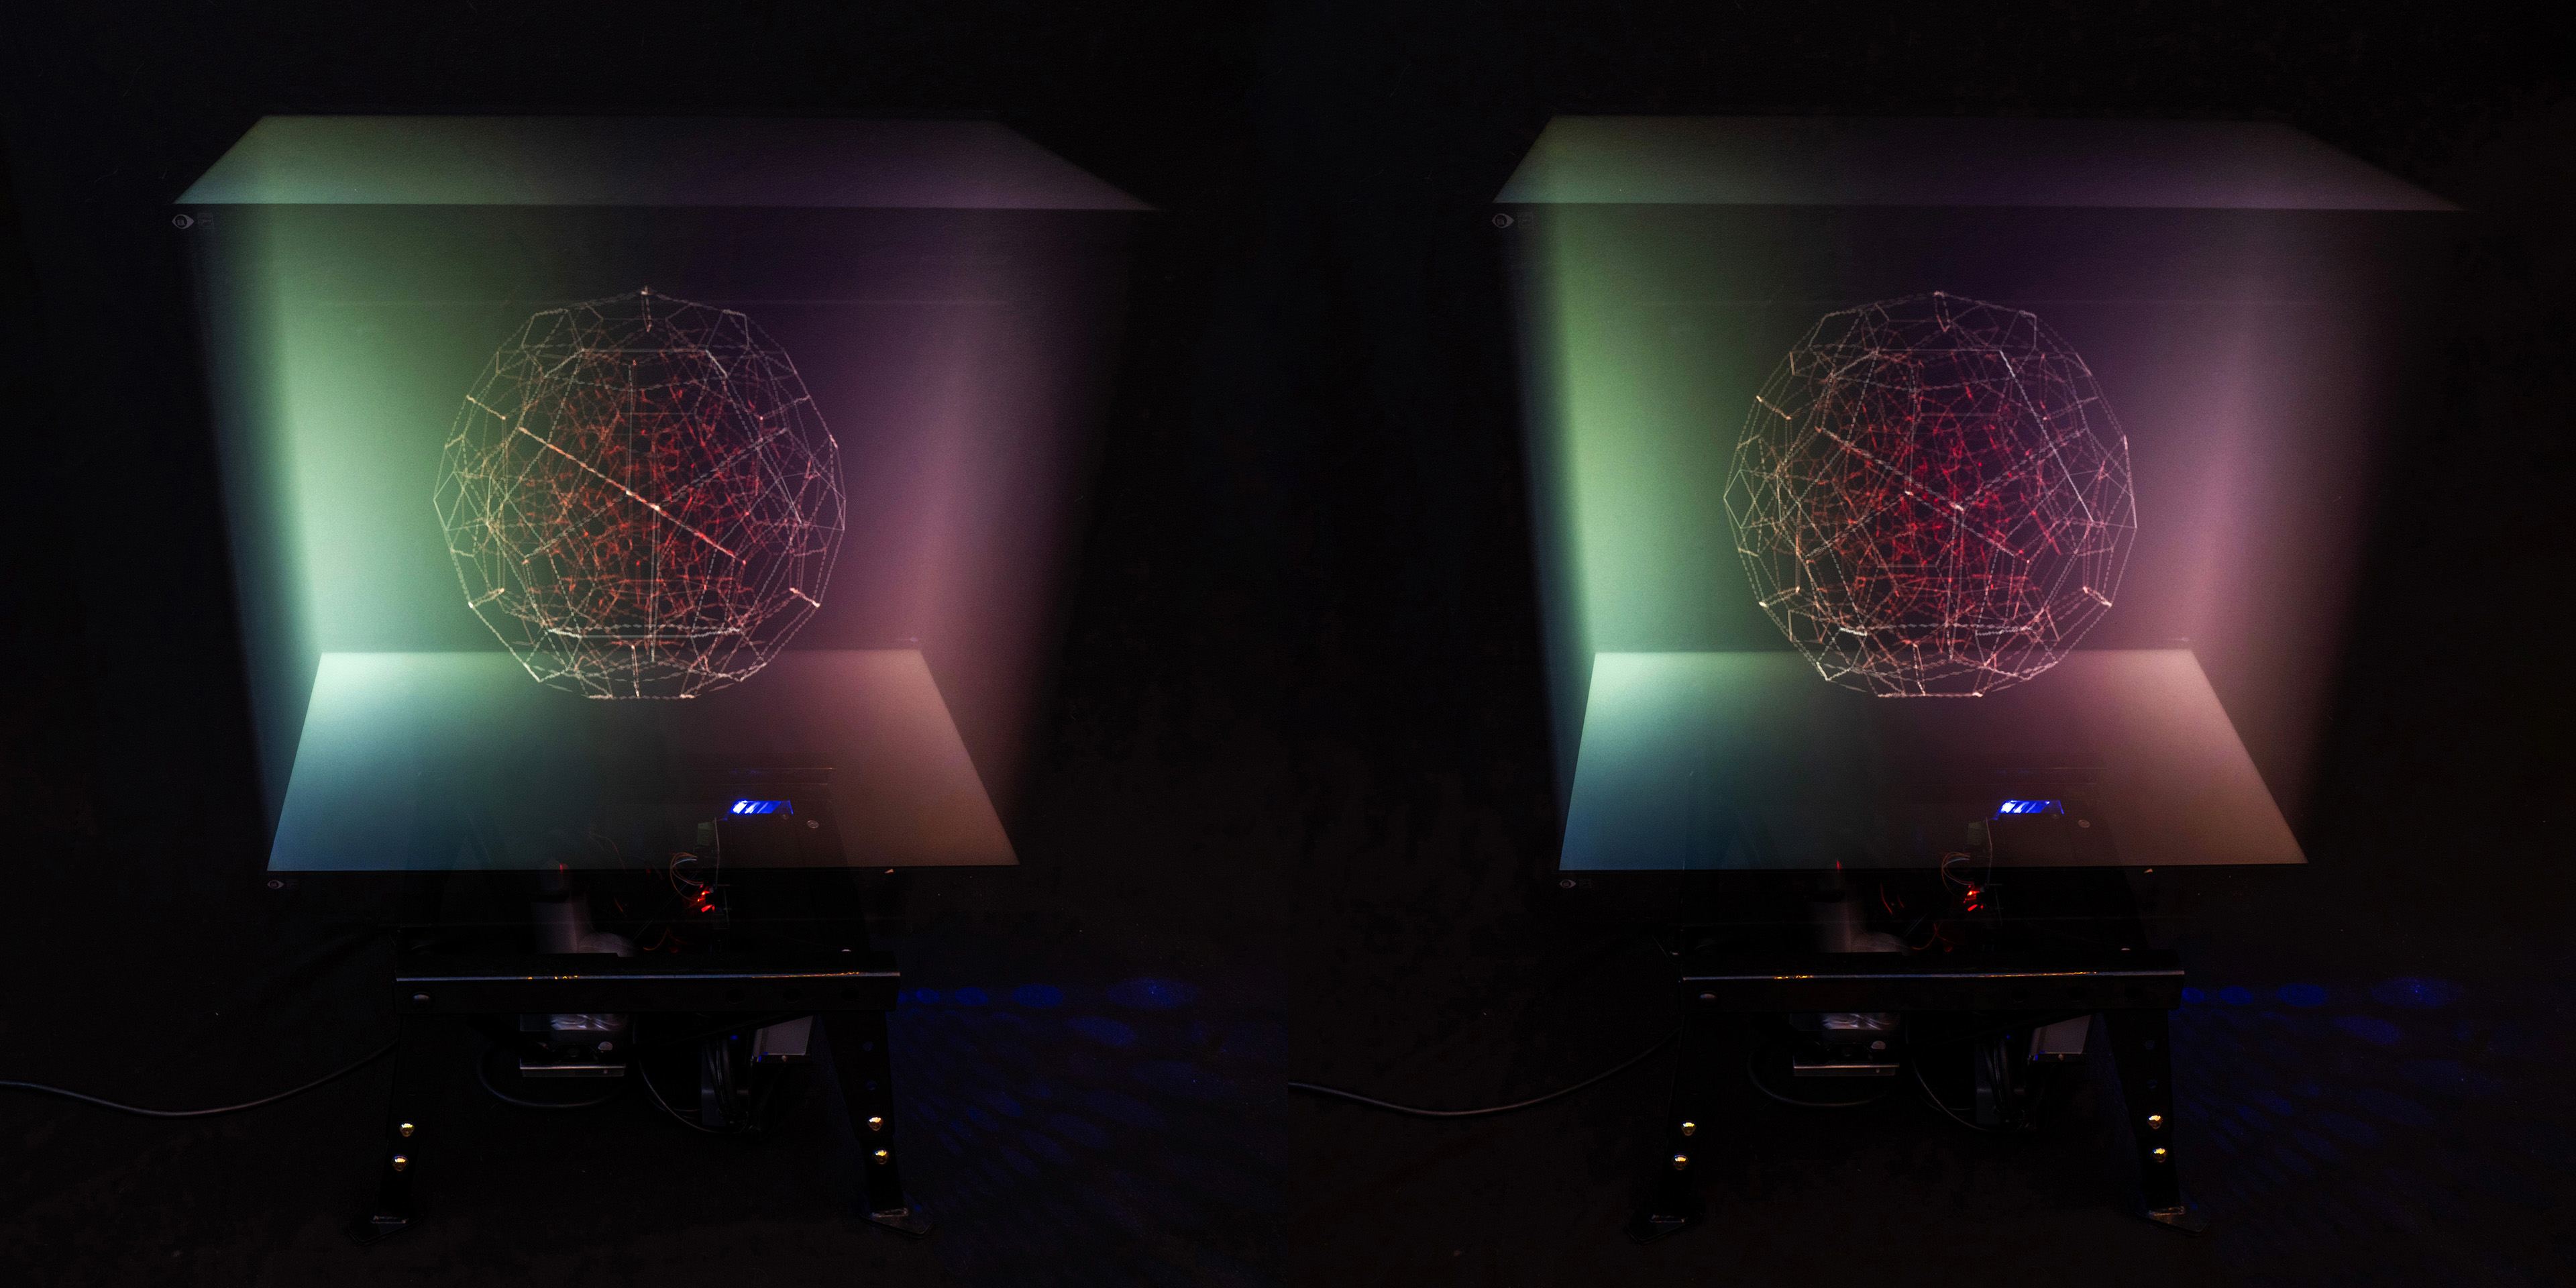
I included the 3D shadow of a 4D hypercube or tesseract, and other four-dimensional analogues of Platonic solids like the polyoctahedron or the hyperdodecahedron.
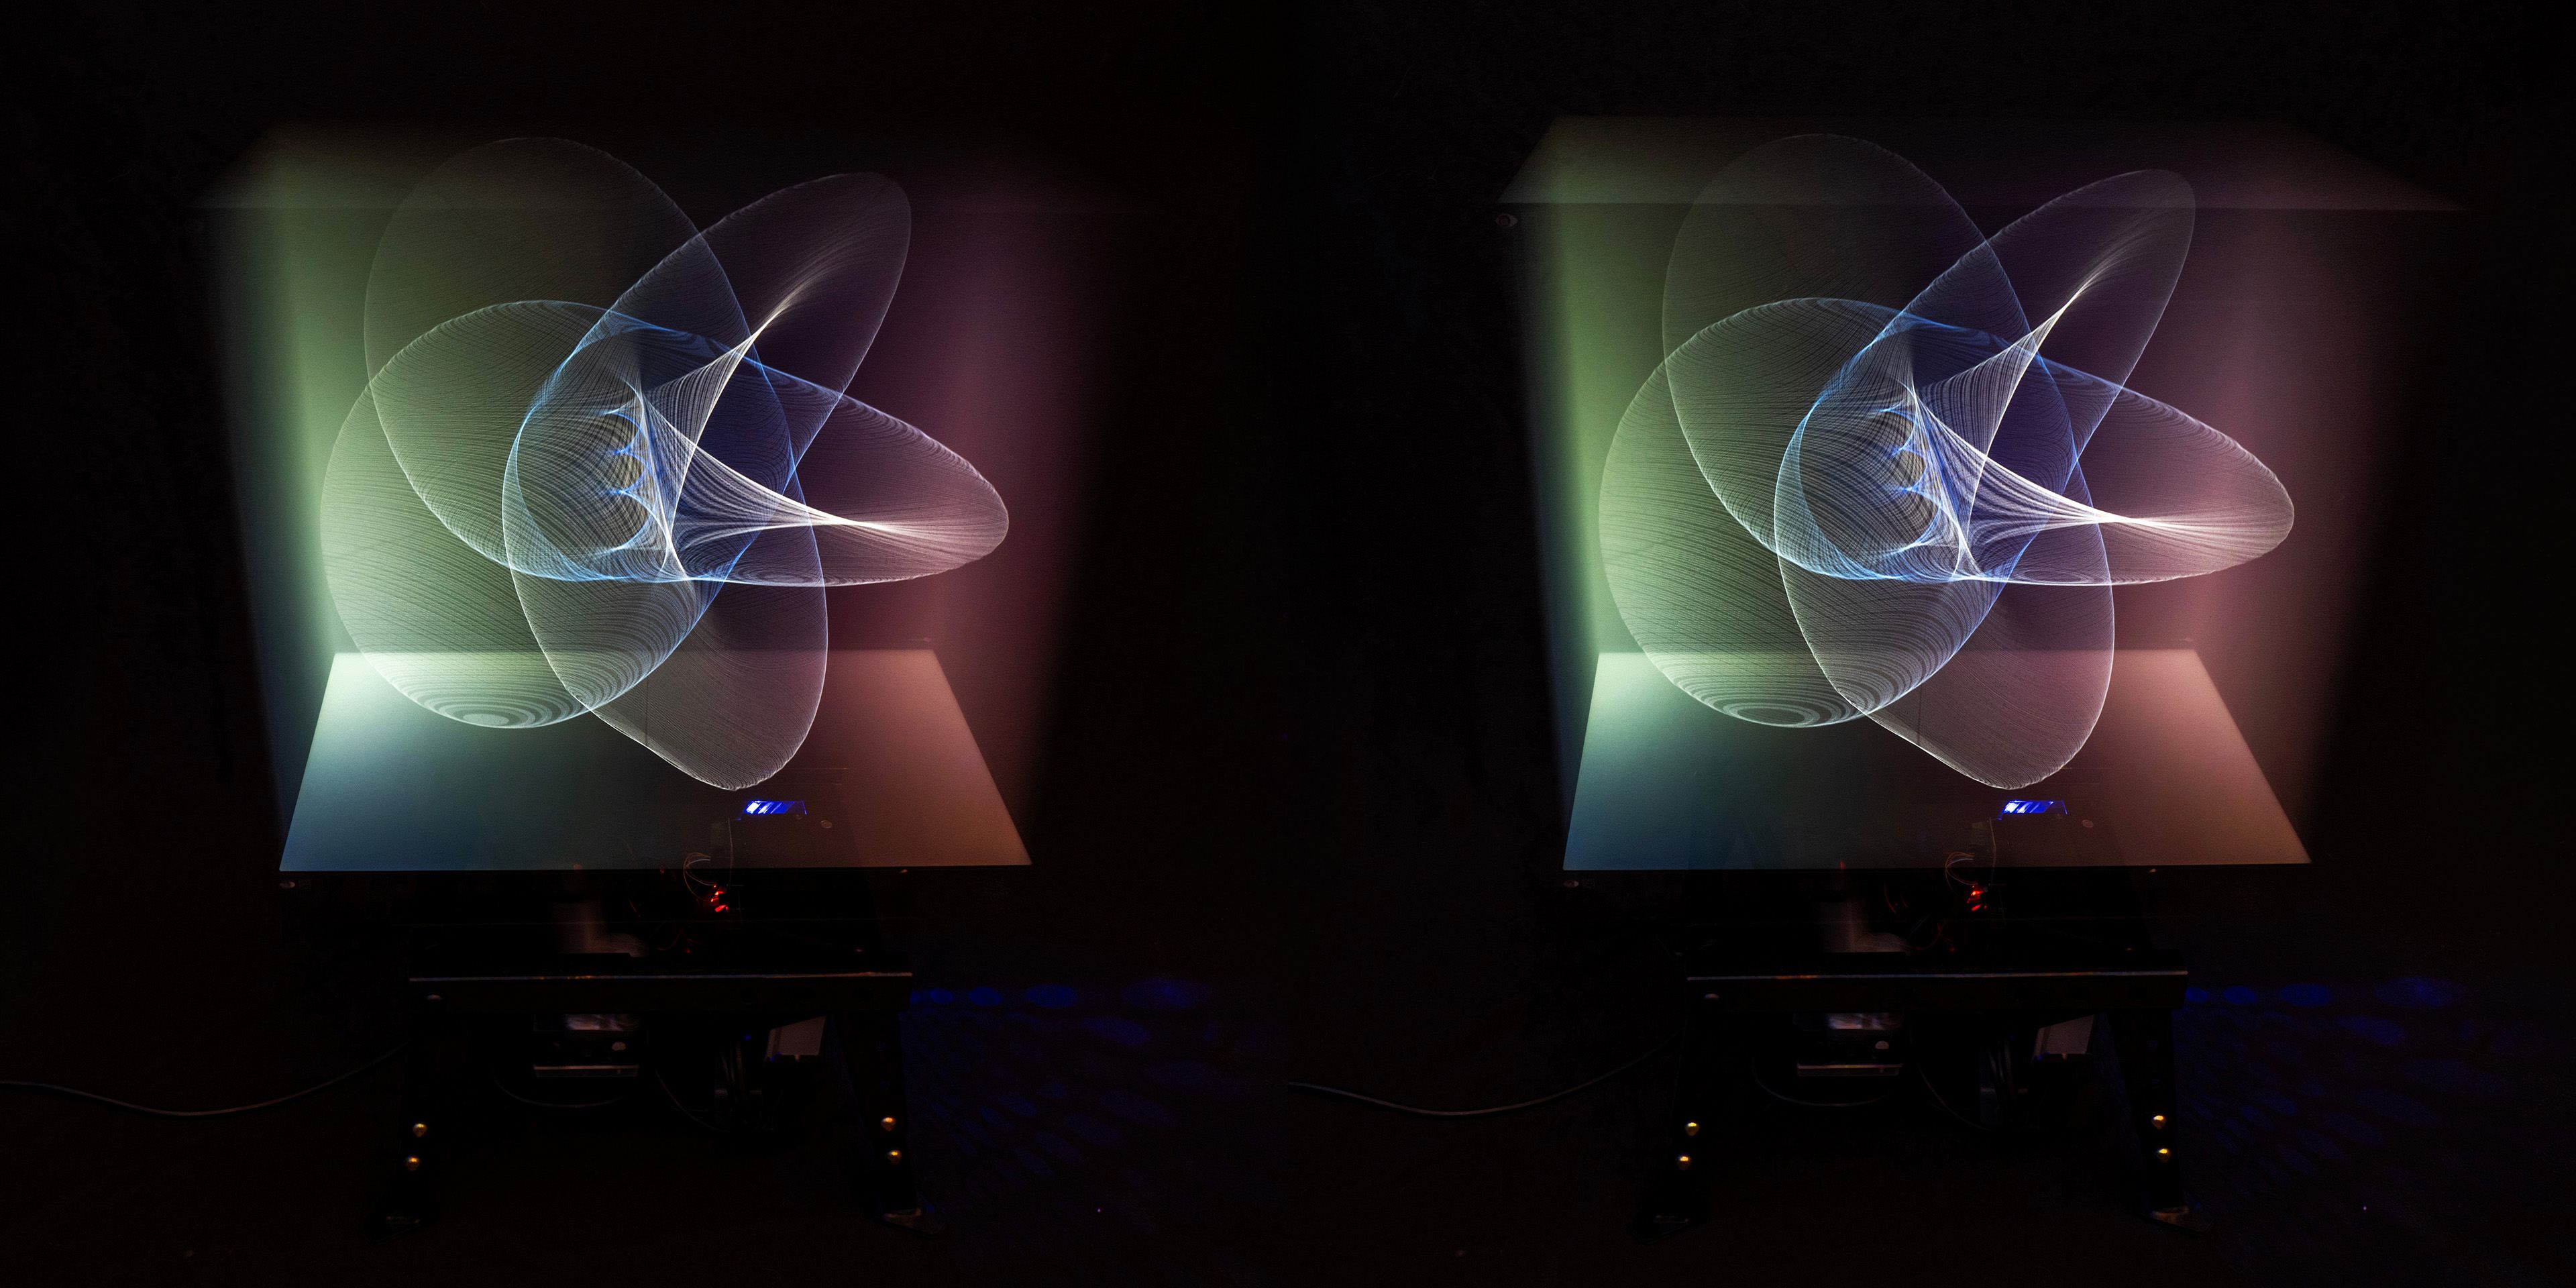
The collection also includes four-dimensional fractals, such as the quaternion Julia fractal, and other higher-dimensional forms such as Calabi–Yau manifolds.
Objects
To move beyond abstract shapes, I included recognizable everyday objects. Using photogrammetry, I scanned things like an apple, a pinecone, myself, a shoe, or a tractor, and then sliced them into image sequences. Public-domain assets expanded the collection with models such as the International Space Station, the James Webb Space Telescope, the Perseverance Mars Rover, a DNA model, and a protein.
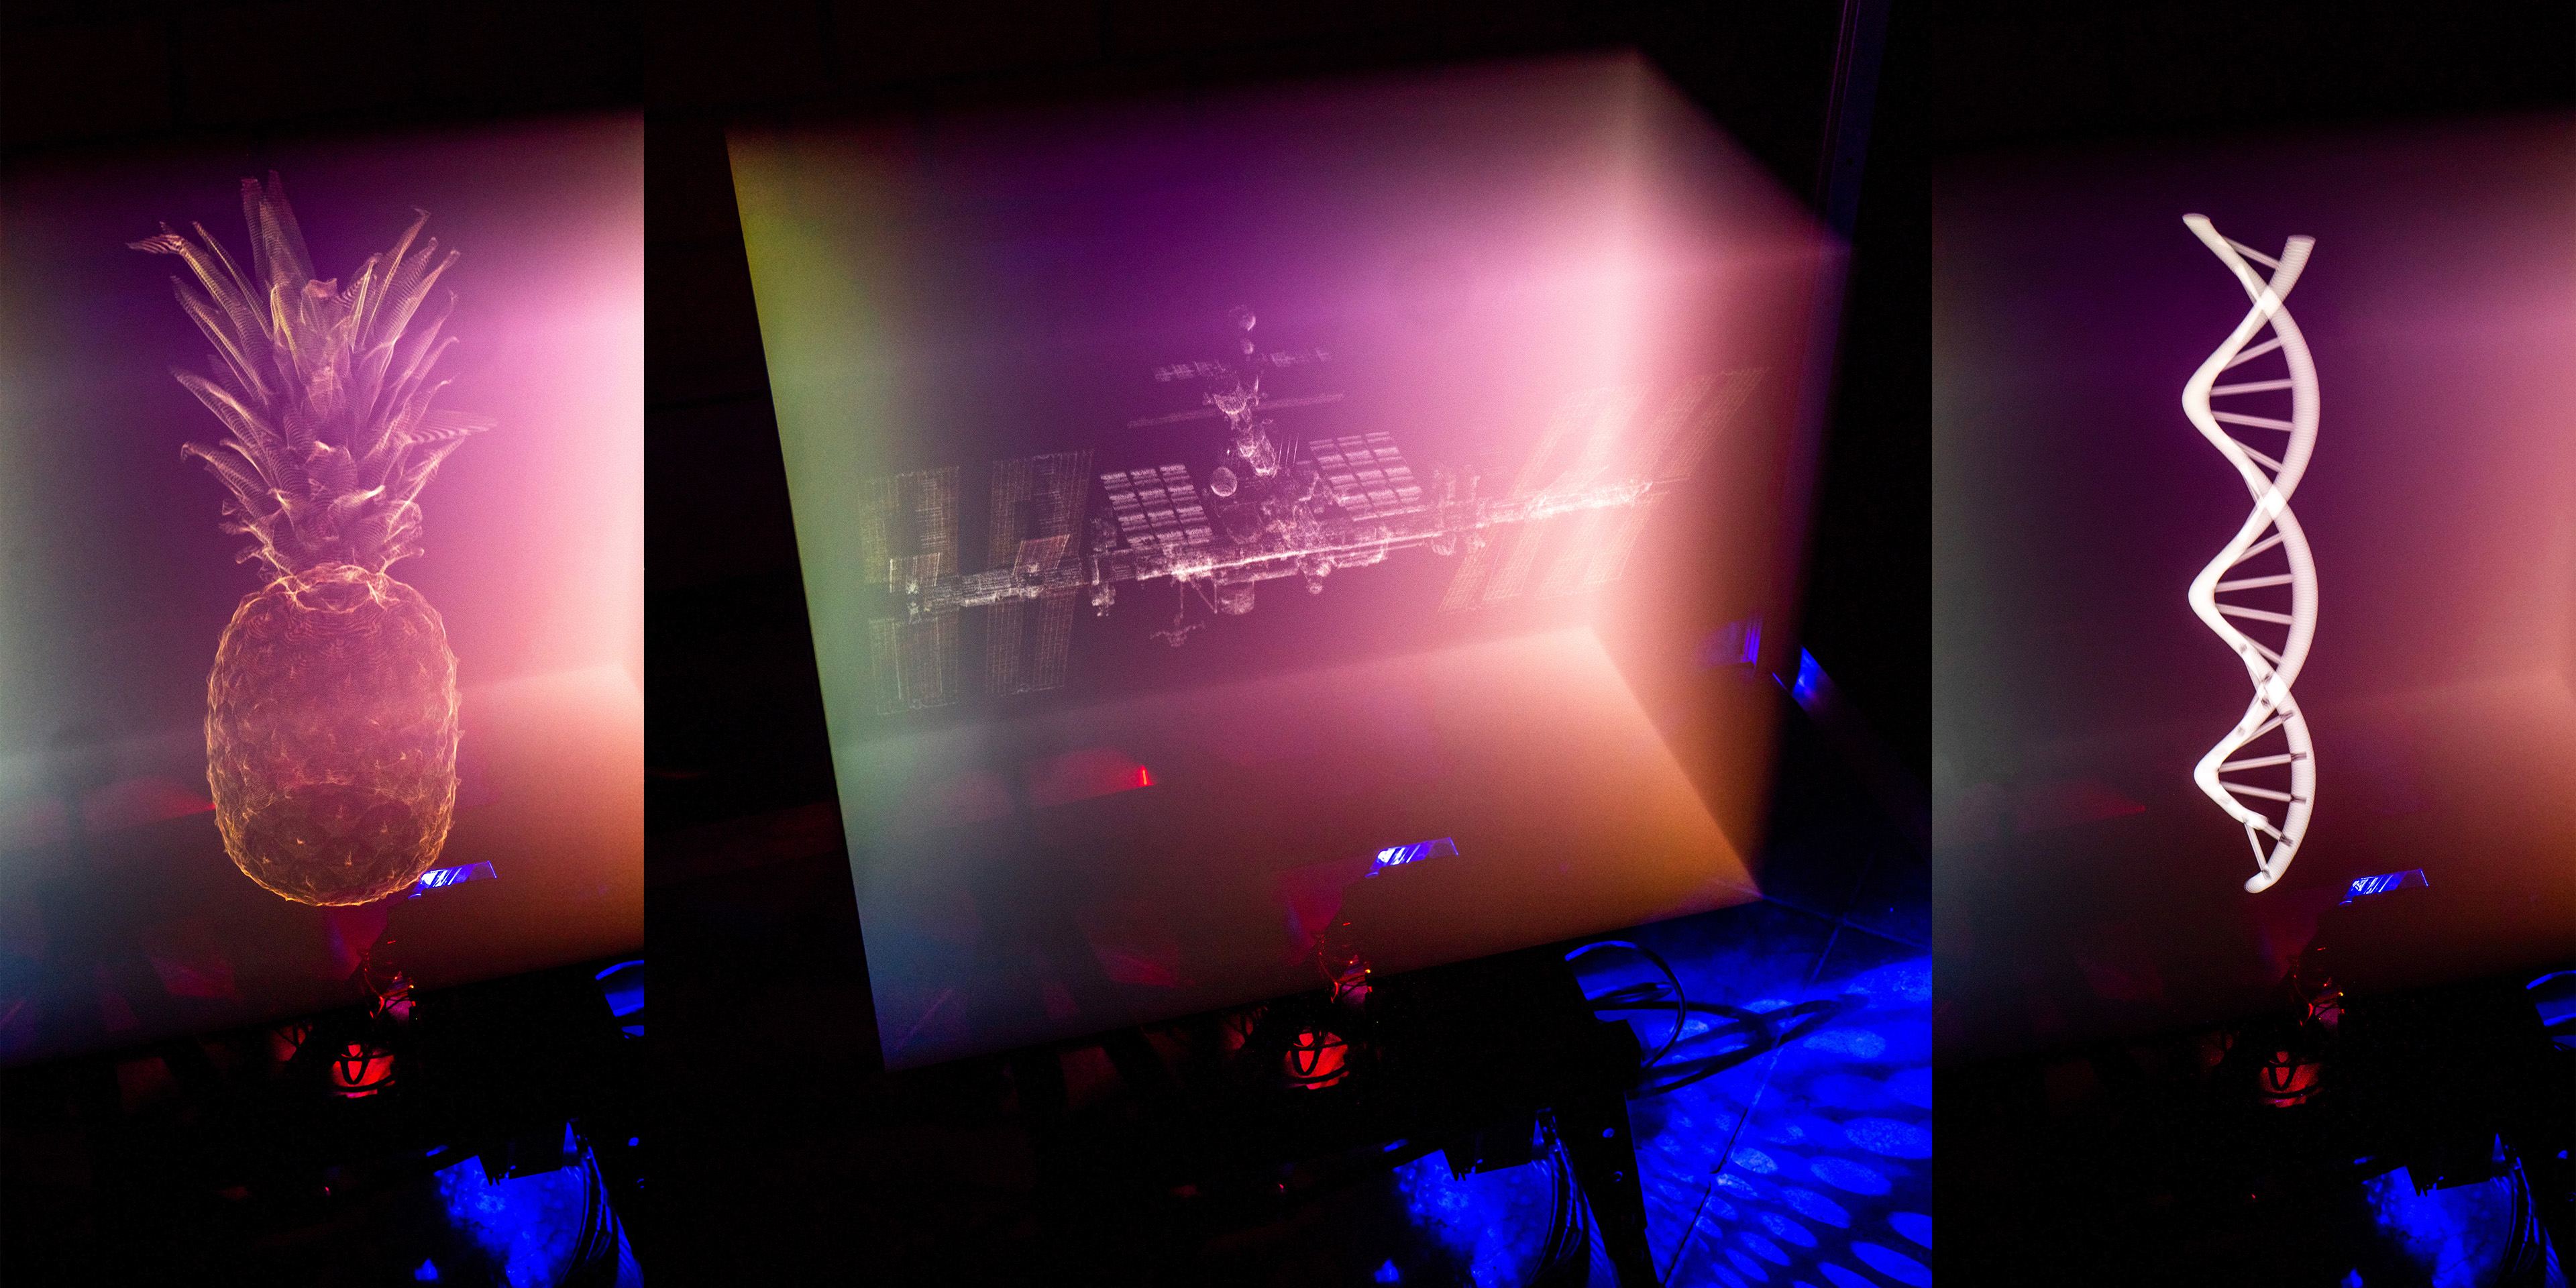
As a self-referential element, I included a 3D model of the lift itself and a version with the surrounding dodecagon frame, as it appeared during the installation.
Spaces
I wanted to add more self-referential images to the installation, so I used an omnidirectional camera to scan it. After stitching together the equirectangular image set, I split it into multiple single frames, then used photogrammetry software to calculate a point cloud of the exhibition space. I also trained a Gaussian Splatting model on the space and turned it into a sequence.
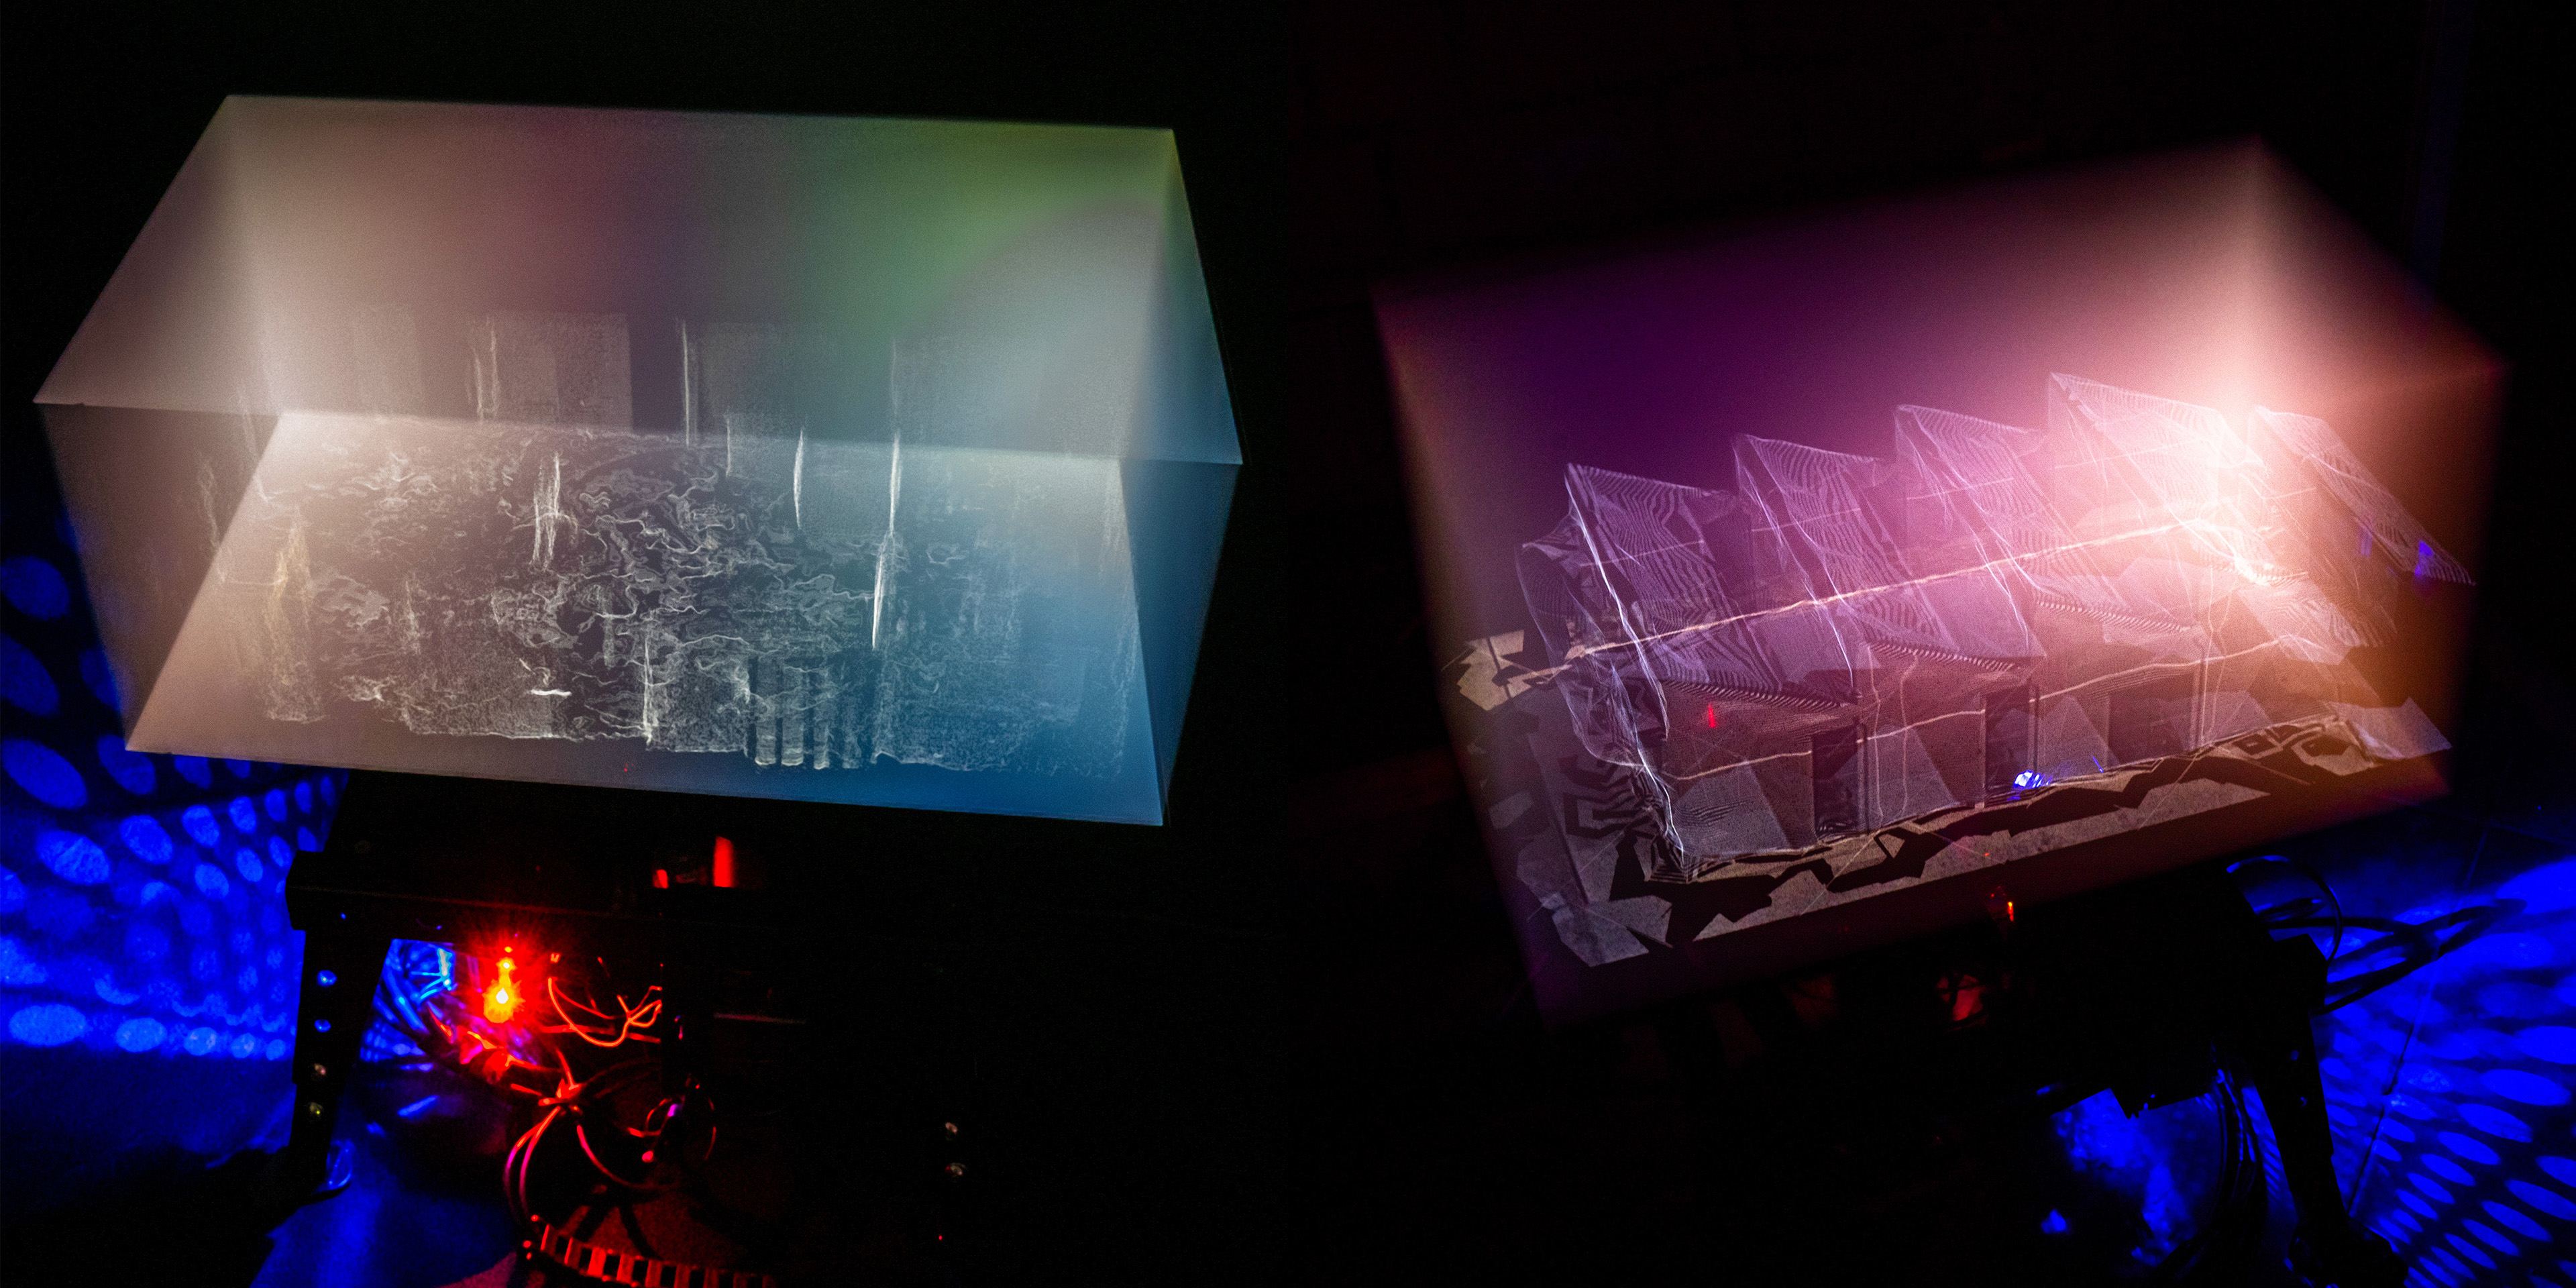
To extend this idea beyond the exhibition room, I added a satellite-based 3D reconstruction of the building and broader models of locations in Bremen.
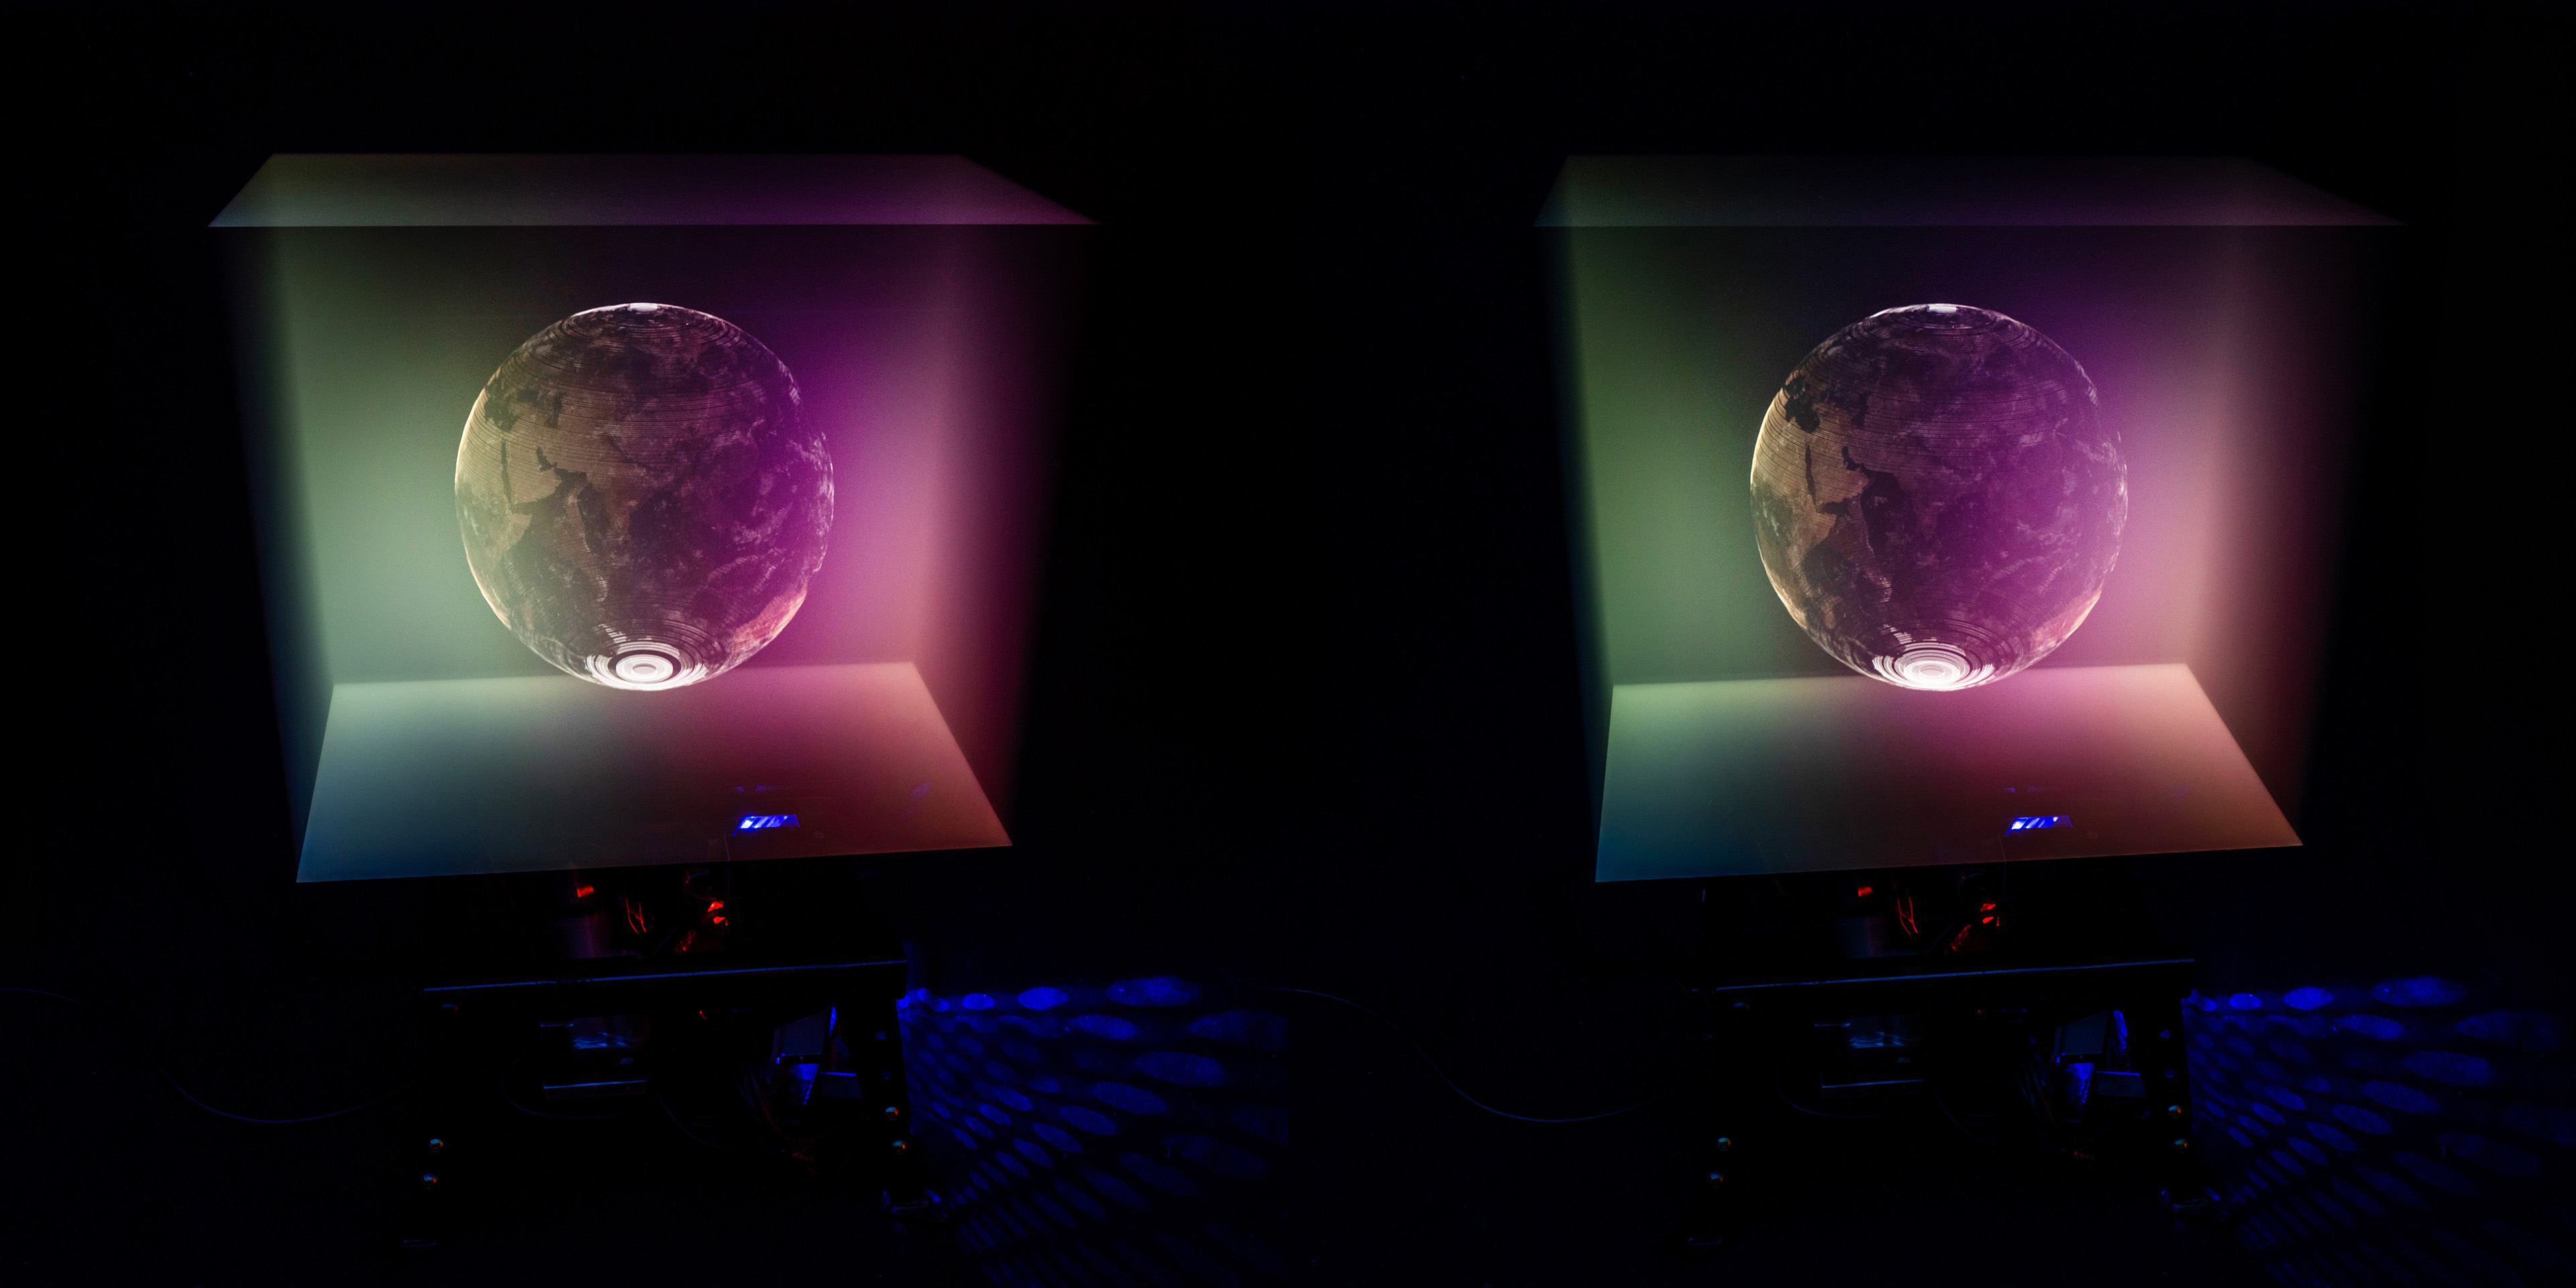
Zooming out further, I also included the entire planet Earth and the planets and other objects in the solar system.
Universe
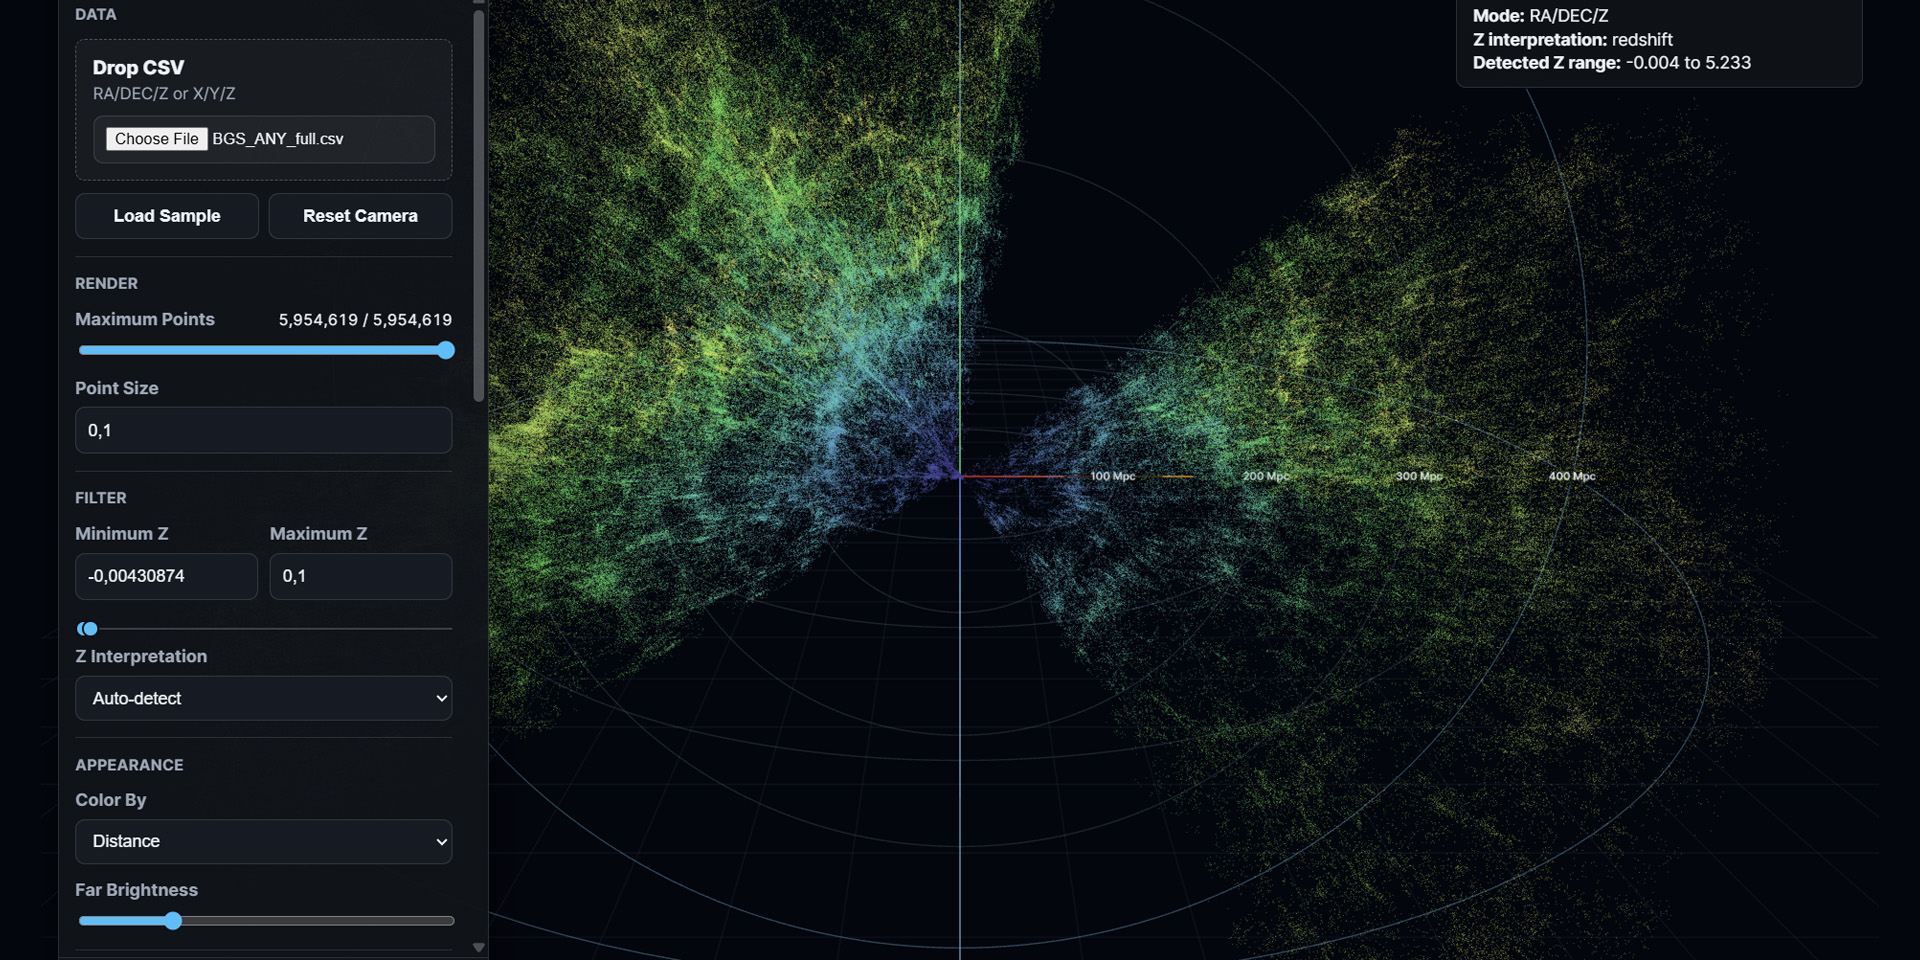
I used data from the DESI (Dark Energy Spectroscopic Instrument) to visualize the deeper structure of the universe. I converted the redshift data into a point cloud, where each point represents one galaxy. When I sliced through this point cloud at distances below about 500 megaparsecs, structures of the cosmic web became visible.
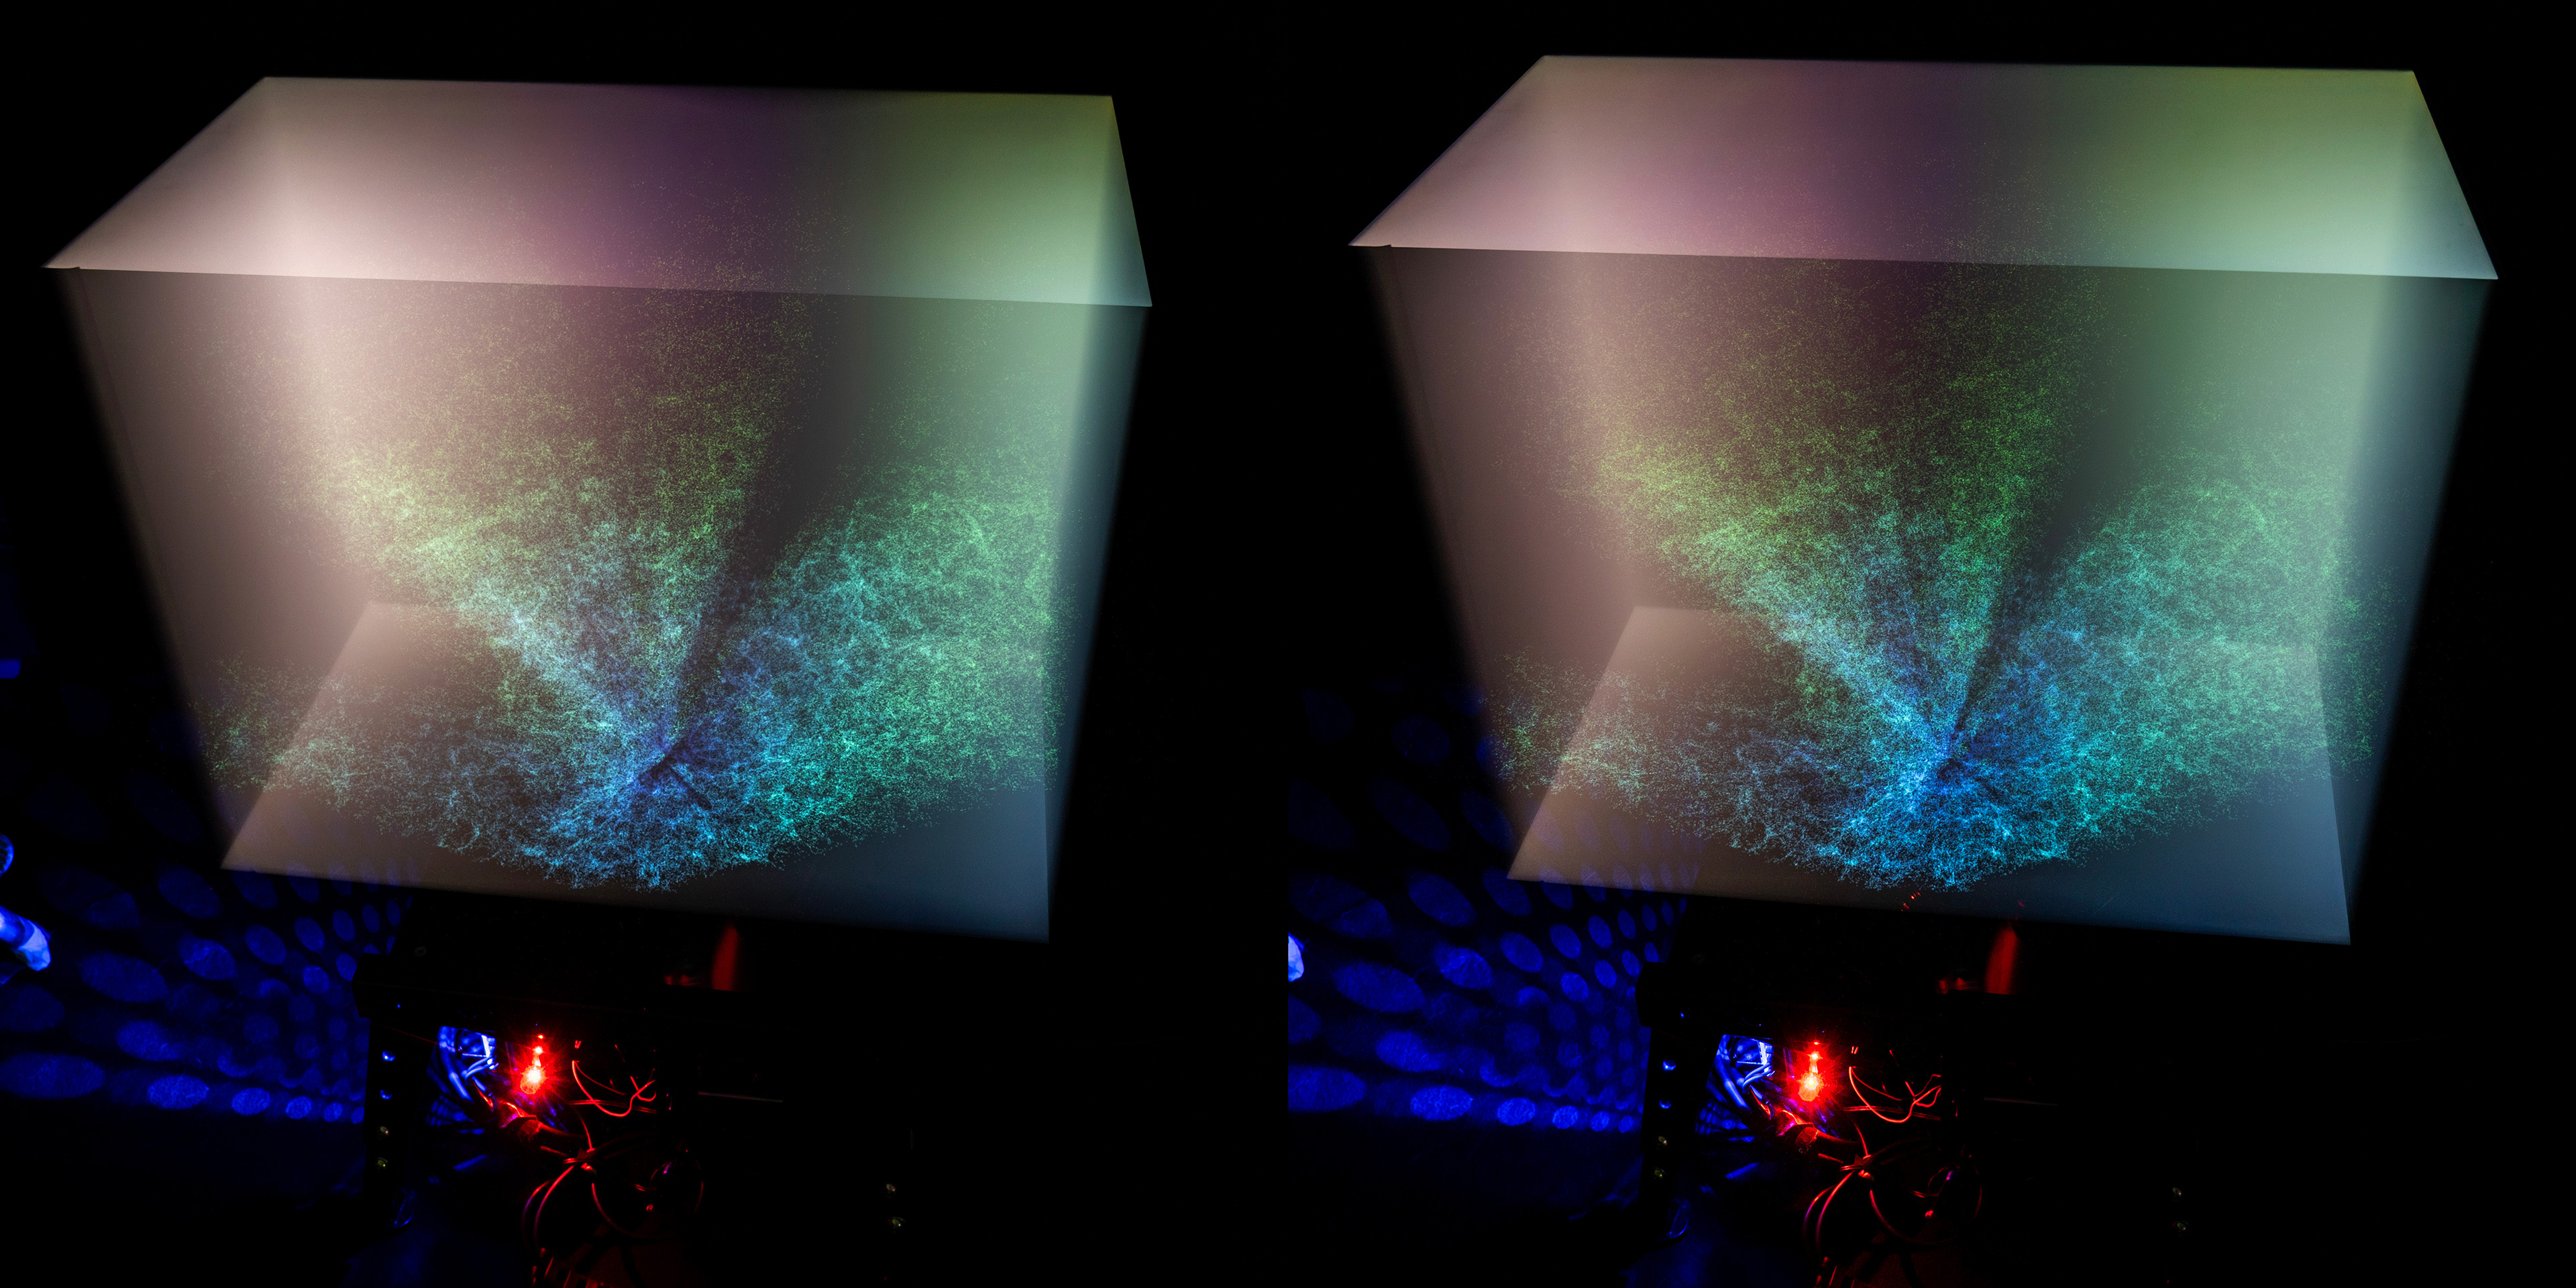
The process of light-painting a 3D object with a moving slice allows one to understand the inner structure of that object better. Seeing the cross-sections of the galaxy point clouds reveals the cosmic web structure, but with the motion and accumulating light trail, one gets a better understanding of its true form.
CT scans
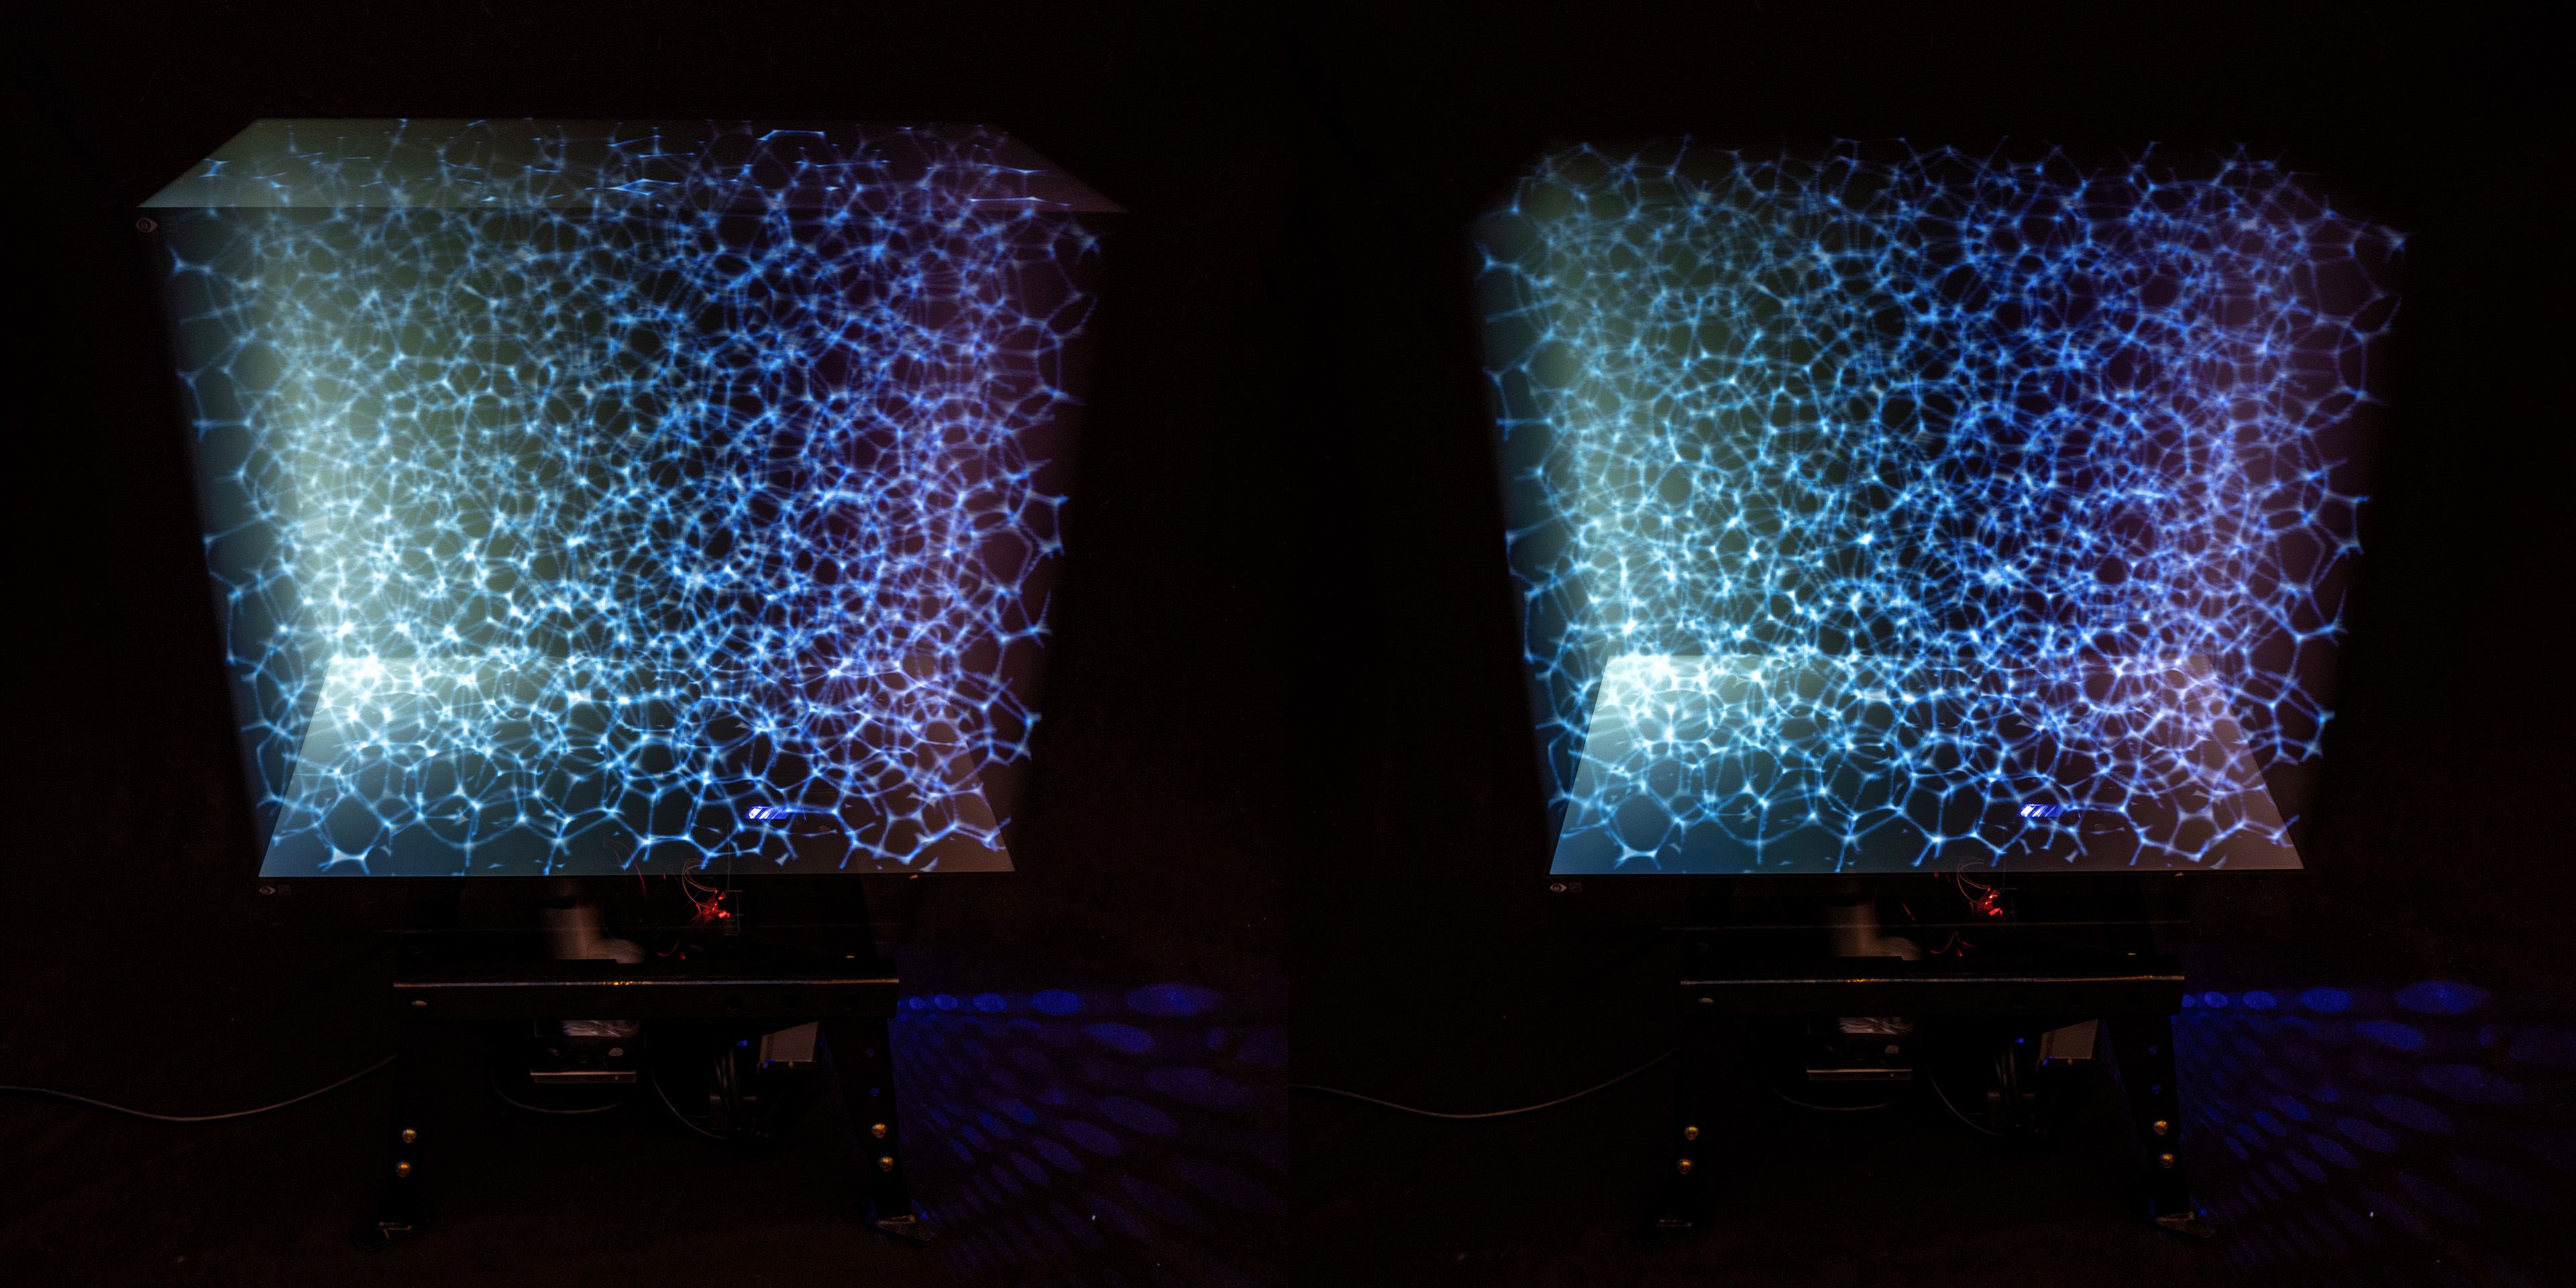
Computed tomography scans can reveal the inner workings of objects, and one way of viewing them is by moving a slice through space. This made them a good candidate for this display. I experimented with medical and industrial scans. I used Lumafield’s Voyager analysis software to render moving slices of various X-ray example scans. An X-ray scan of a foam sample revealed a cell-like structure that reminded me of the cosmic web.
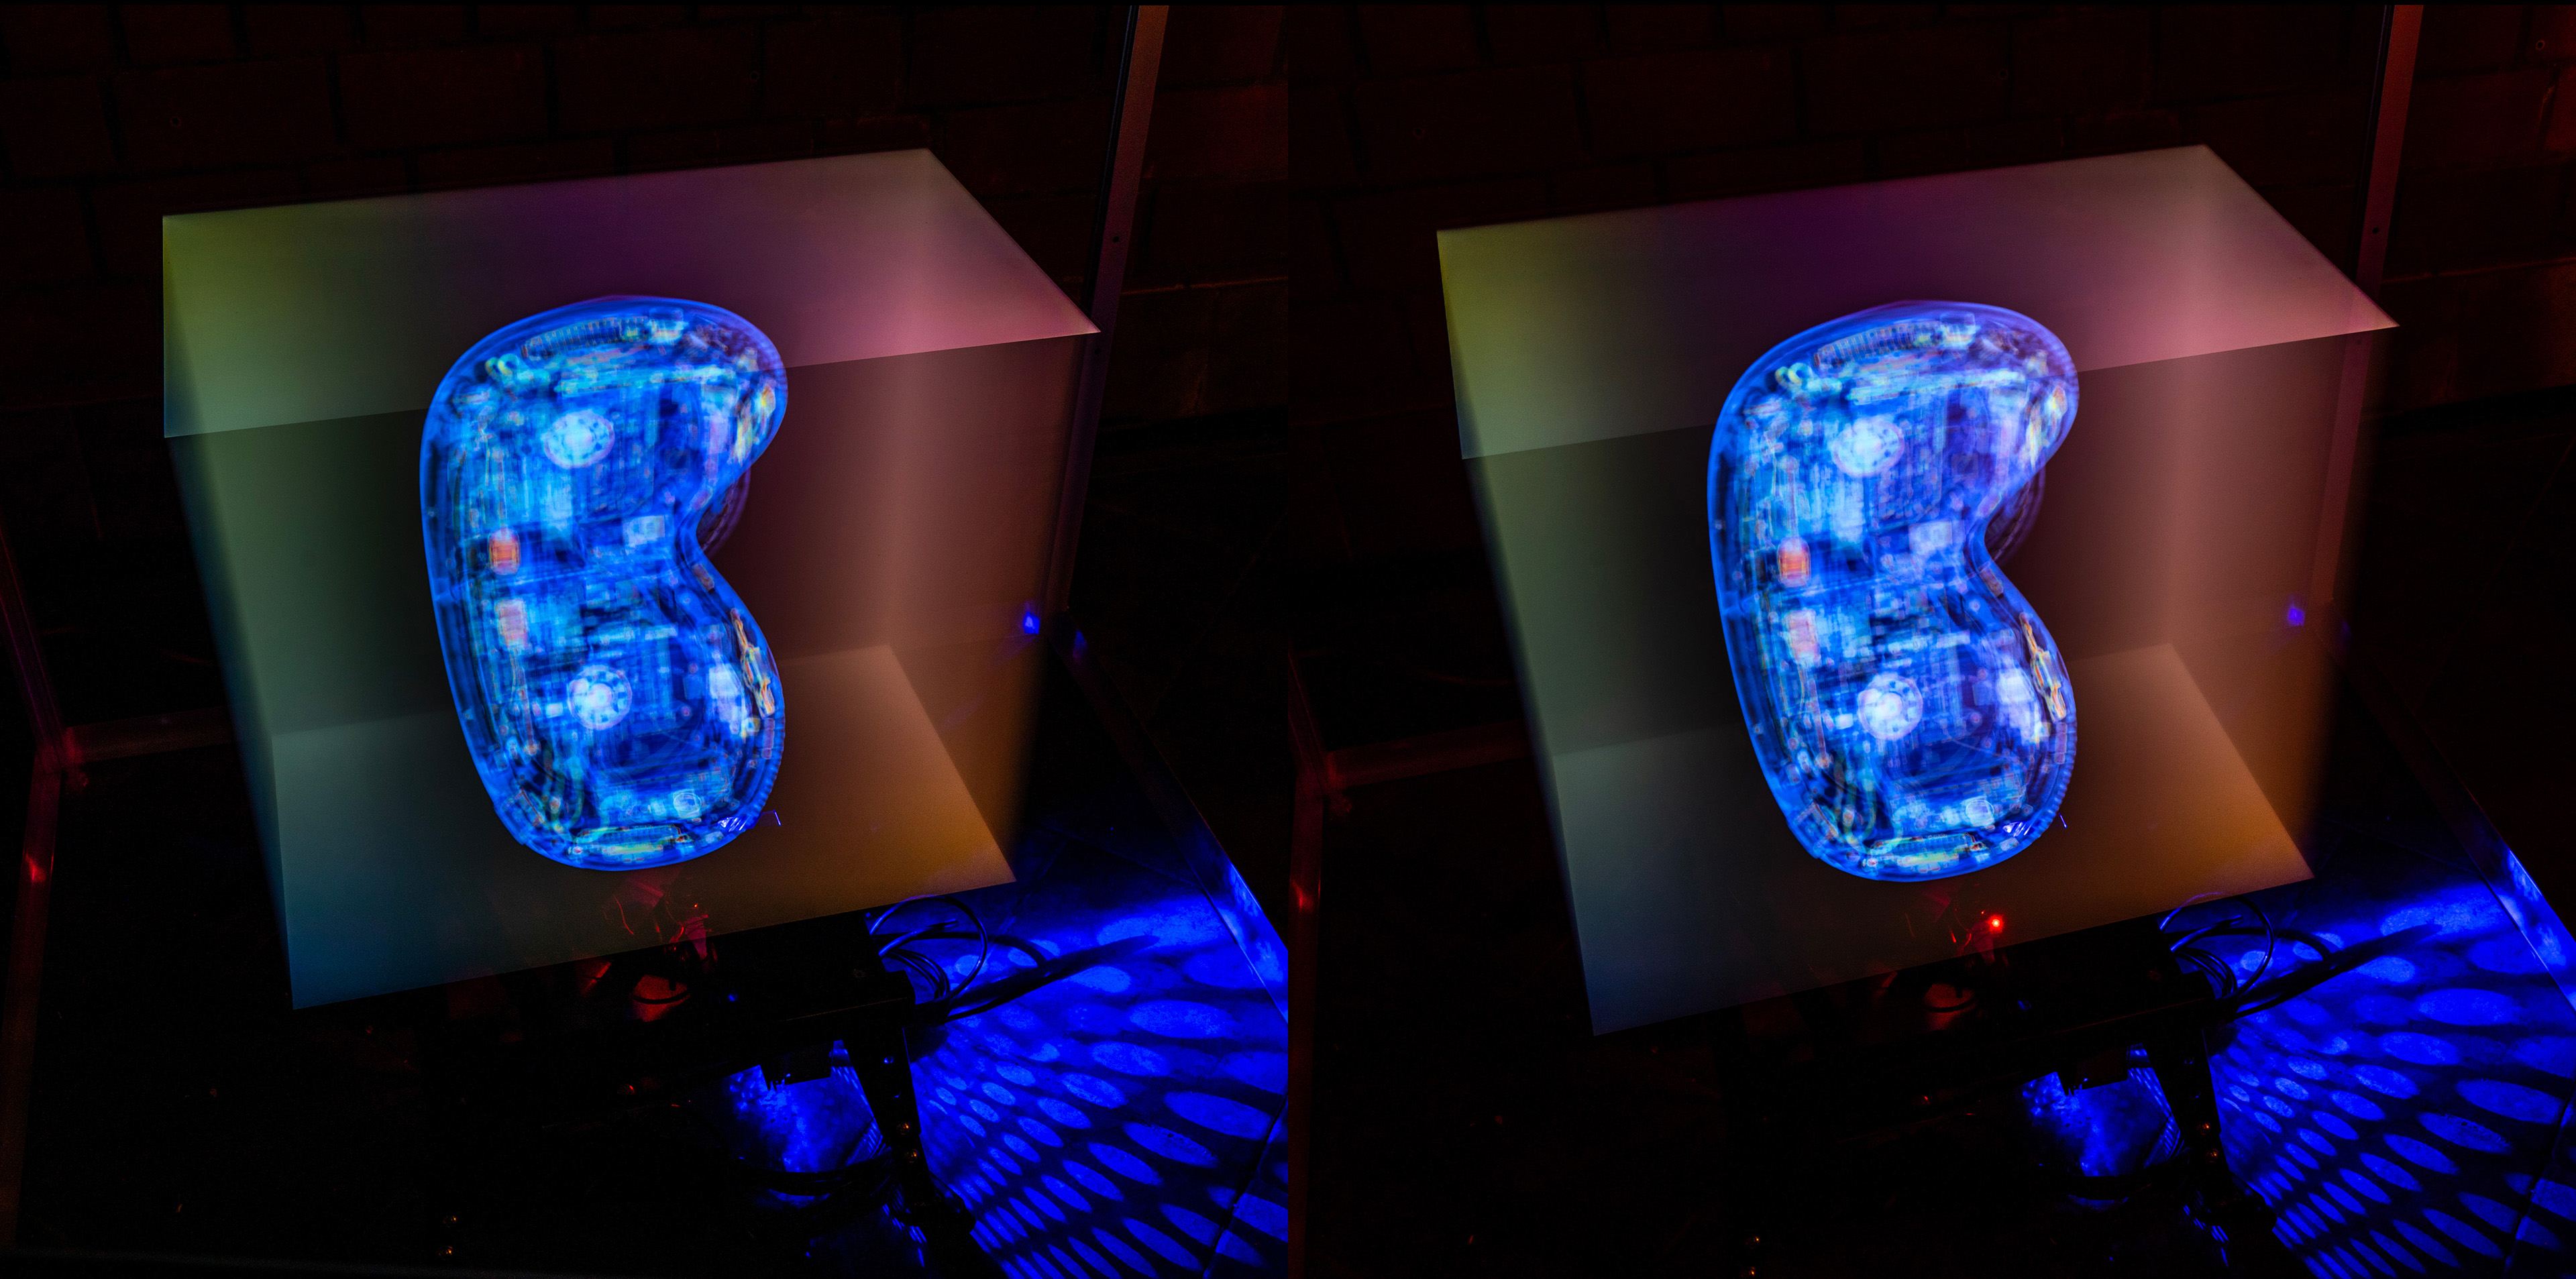
Another interesting scan was of the Apple Vision Pro mixed-reality headset.
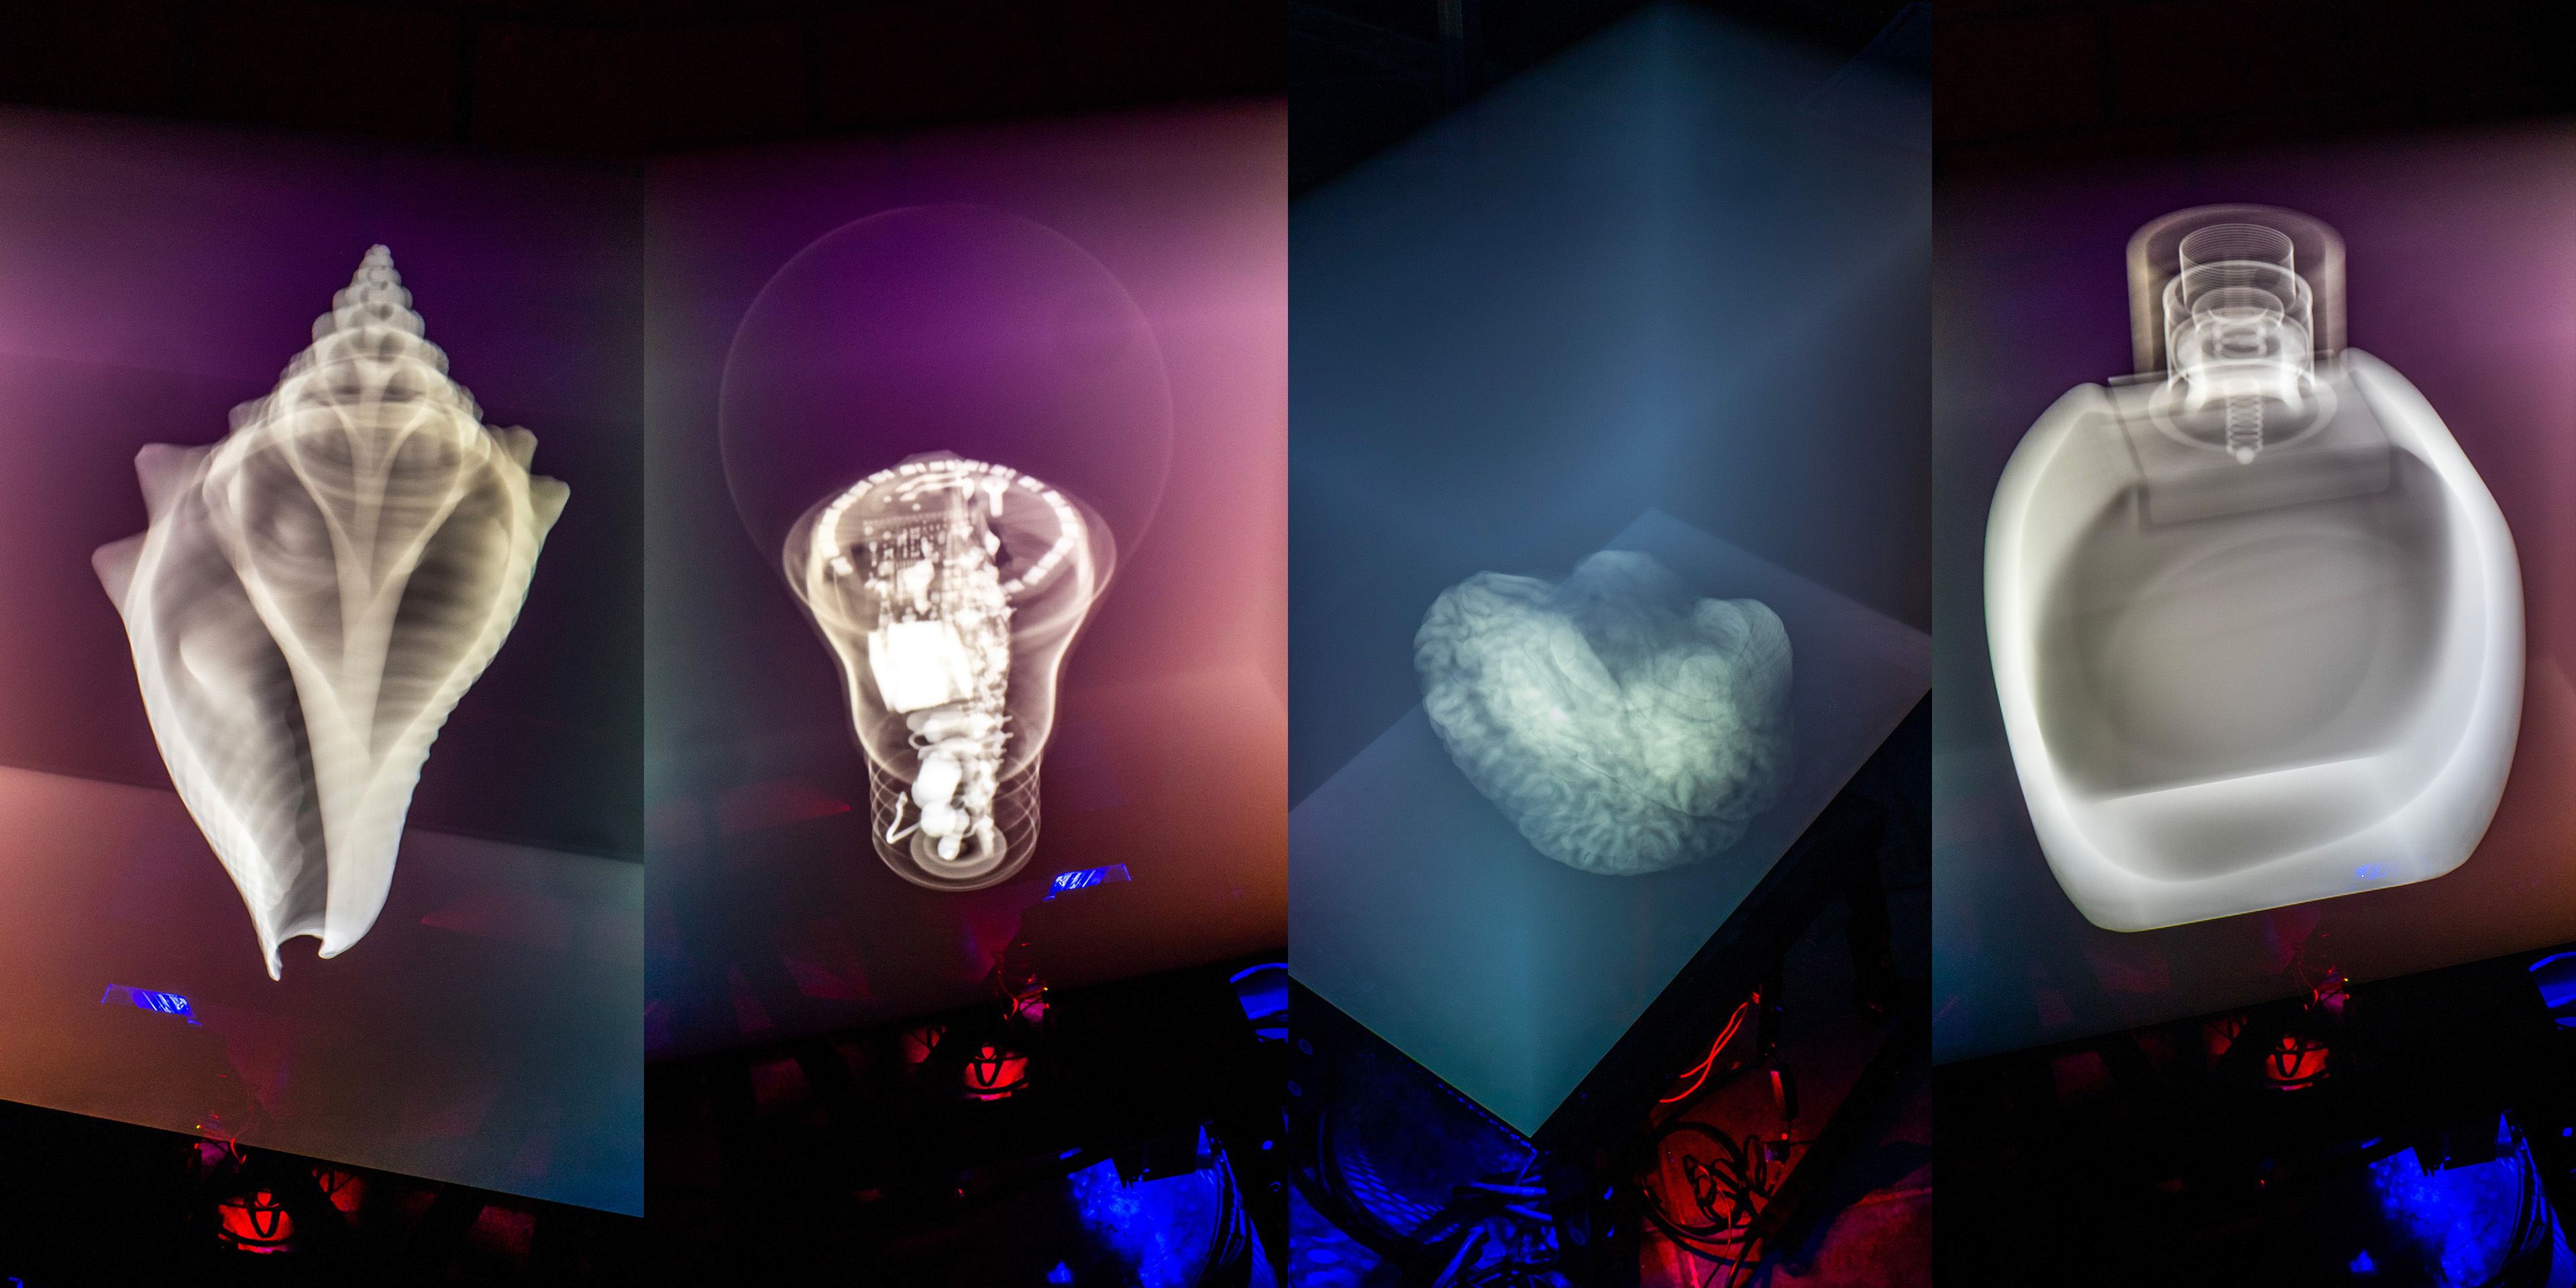
The scan collection includes electronics such as cameras, lightbulbs, razors, and drones, as well as medical scans, plants, animals, shells, fruits, vegetables, and fossils.
Other time-based experiments
Normal 2D videos can also become volumes when they are moved through space as they play. In these sequences, time becomes a spatial dimension, and change becomes visible as a shape. I mostly used videos with black backgrounds, for example, a Newton’s cradle, a blooming flower, an exploding firework, and a slime mold growing in a Petri dish.
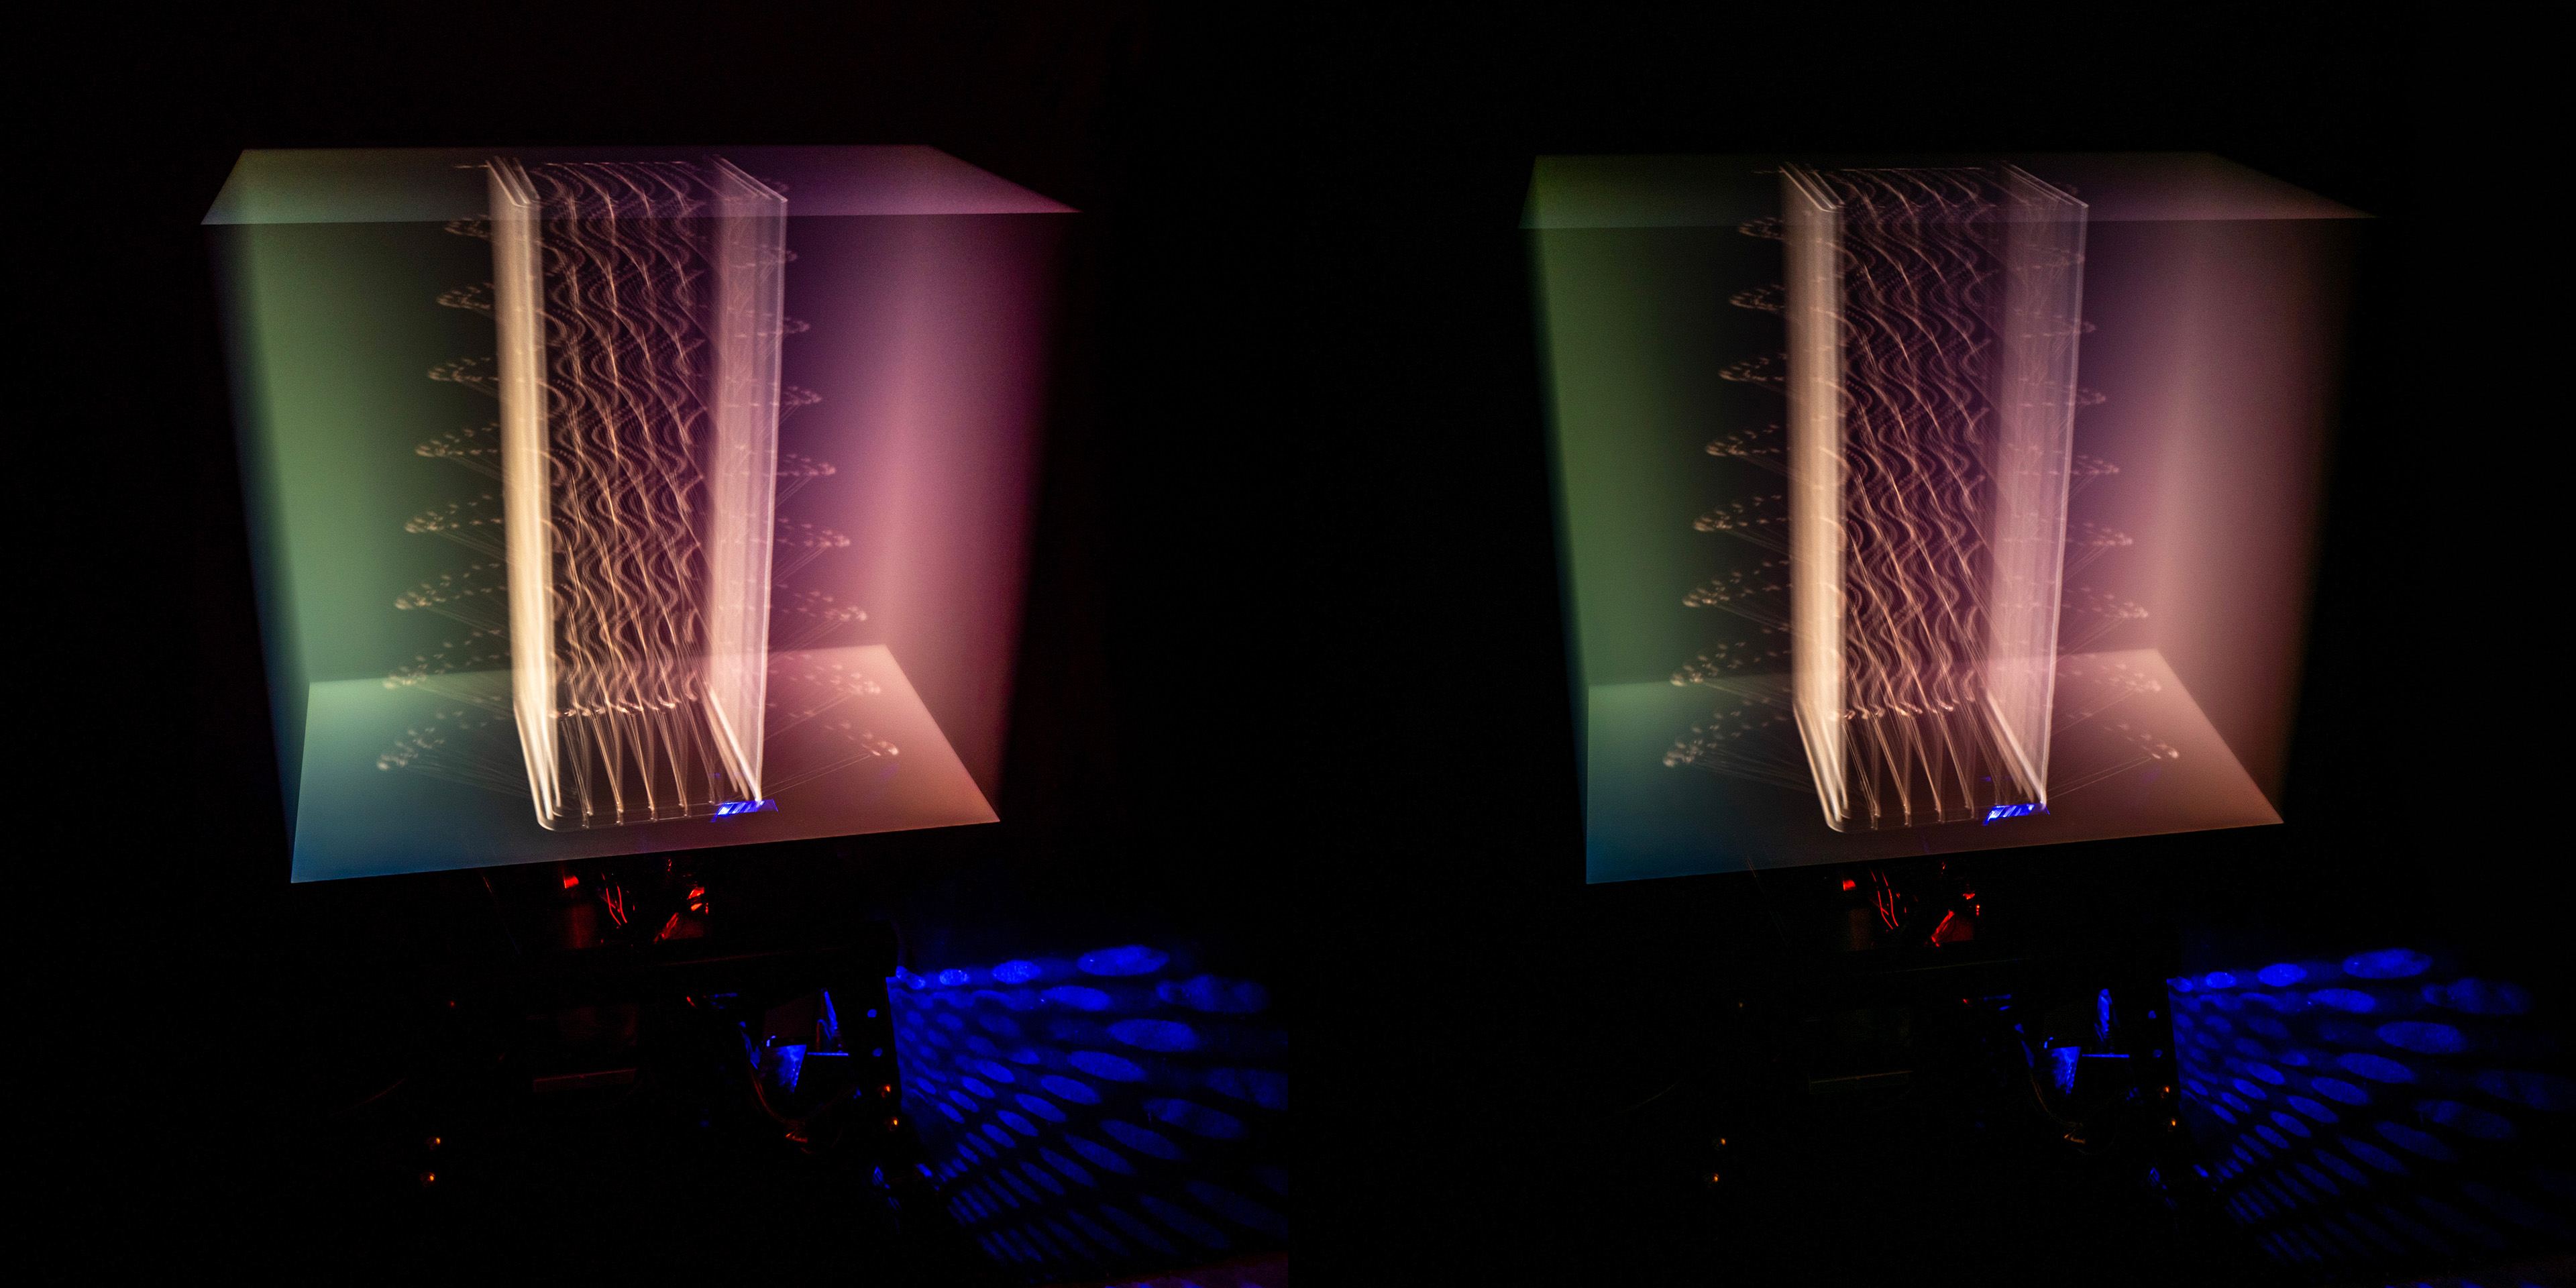
For videos without black backgrounds, I experimented with extracting only the motion beforehand, by subtracting the pixels of the current frame from the pixels of the previous frame. Unchanged areas became black while moving areas became visible in color. This made it possible to create time volumes from the motion itself rather than from the full image.
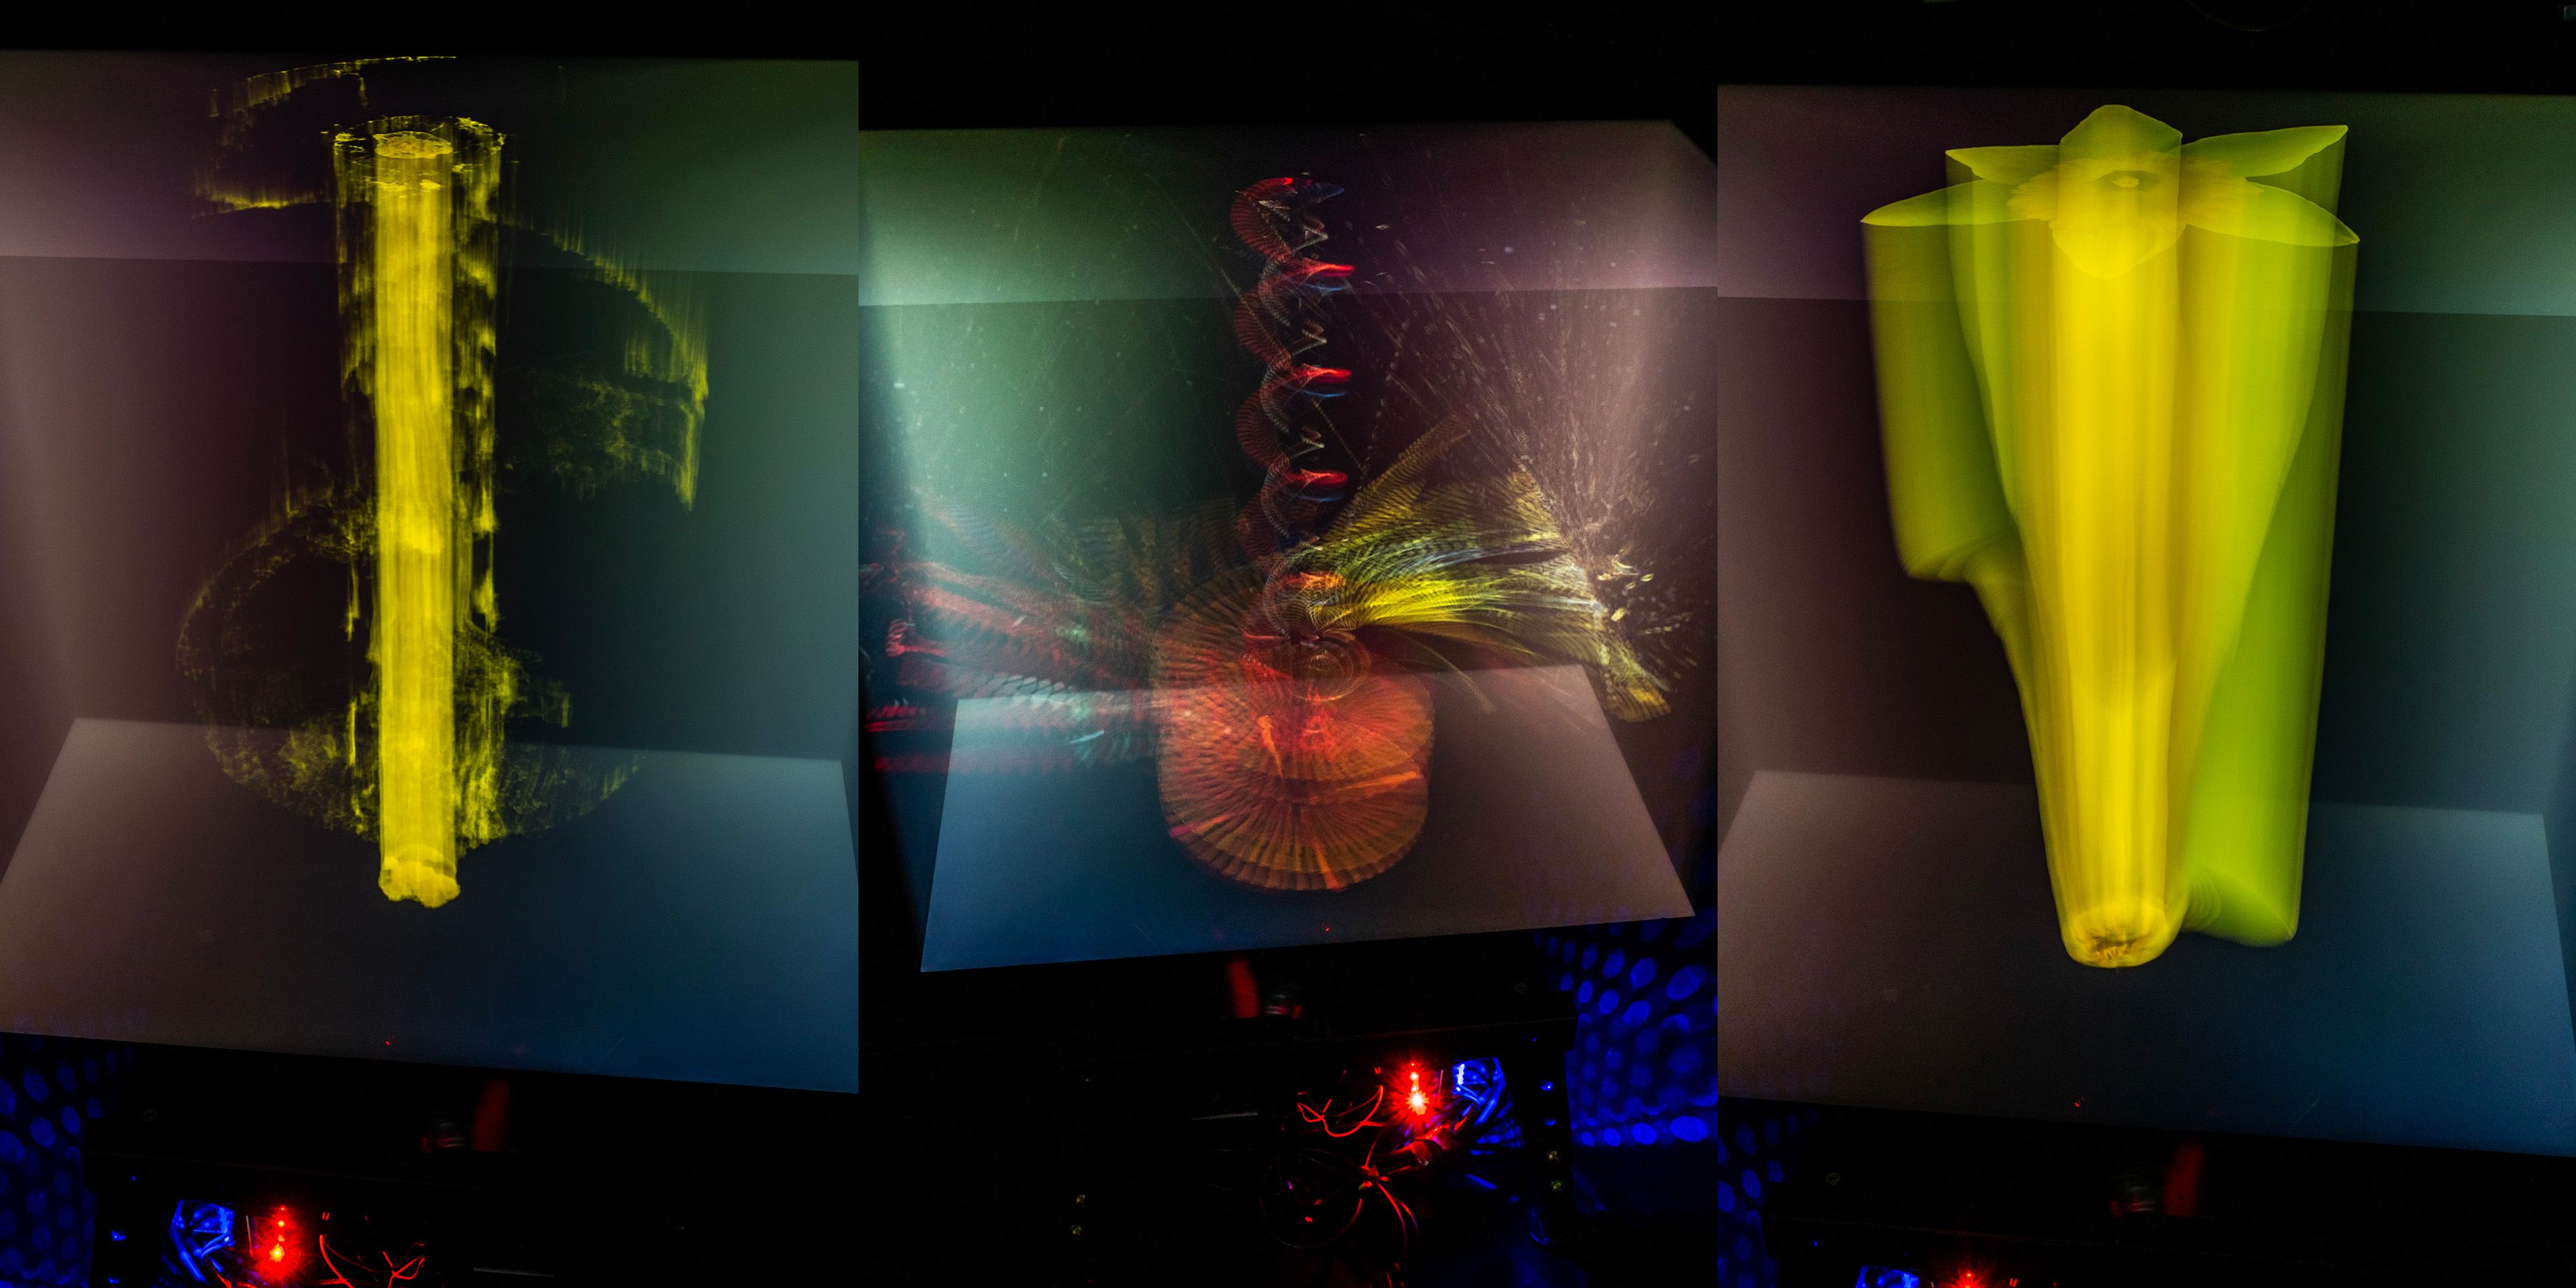
I also made some animations of 2D shapes moving in regular repeating patterns, which became spiral and symmetrical 3D shapes. Using particle simulations produced abstract sculptures, where the motion of the colliding particles became the 3D pattern.
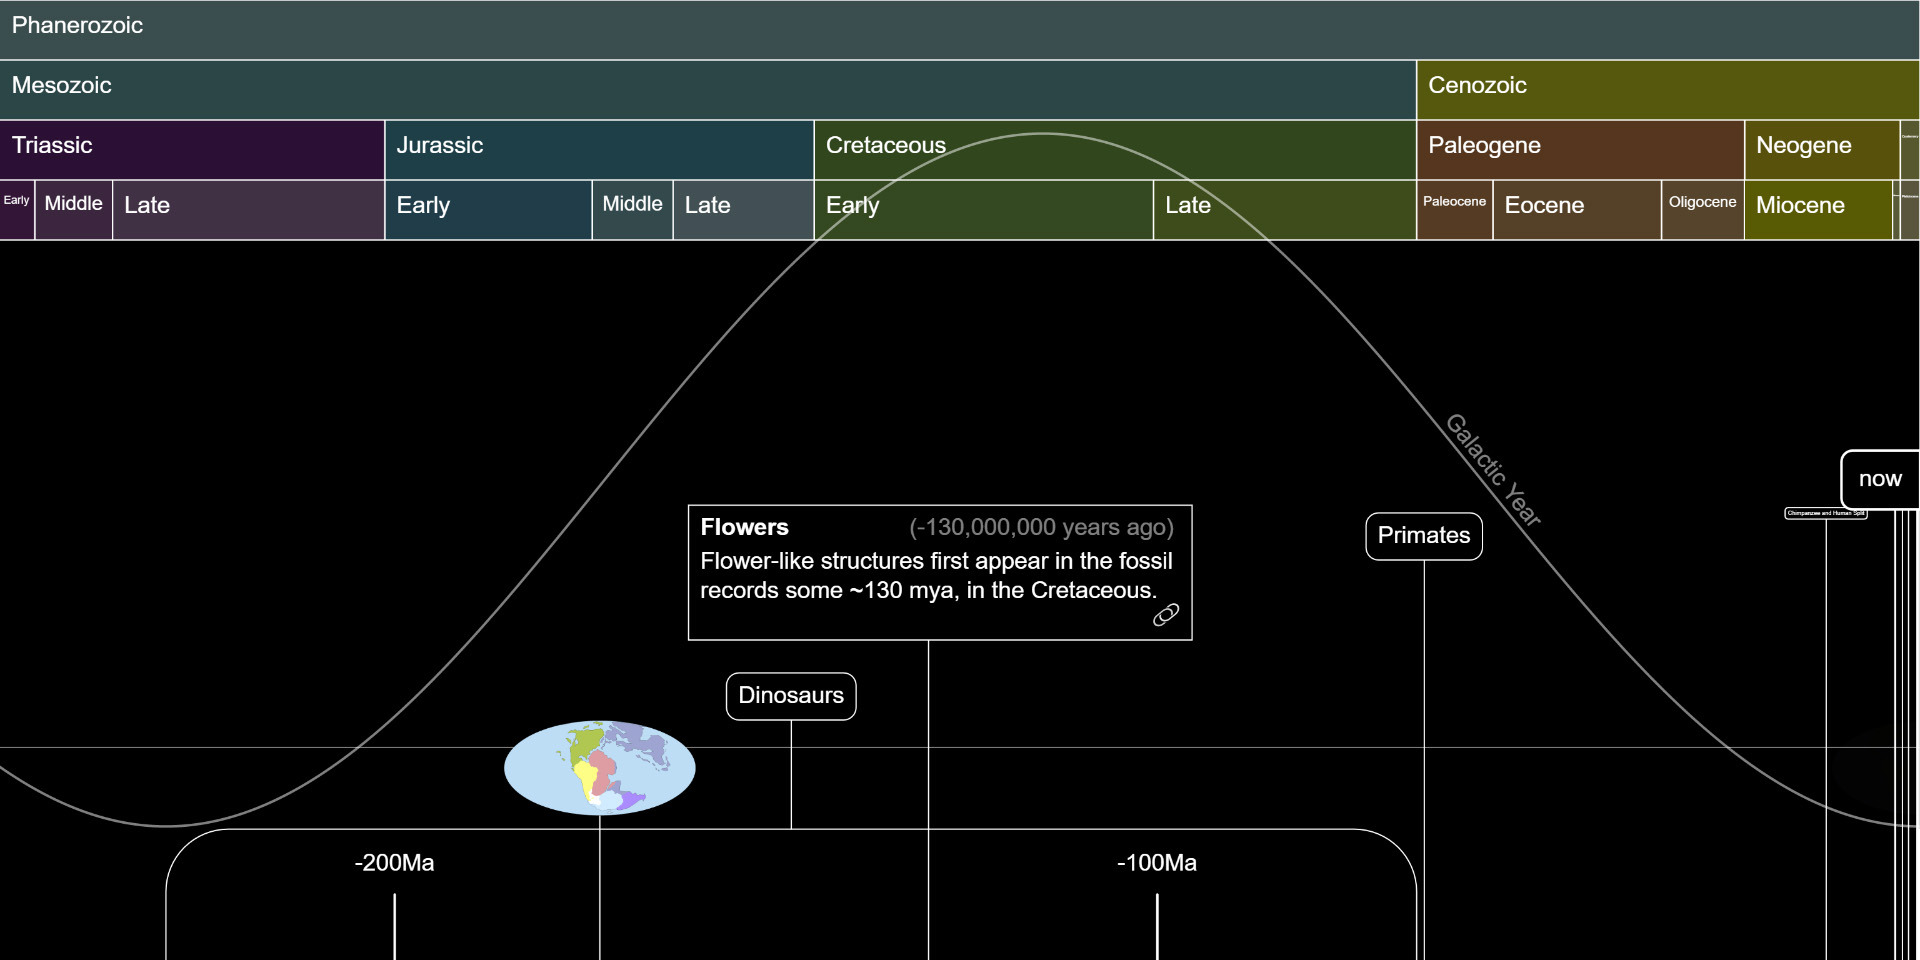
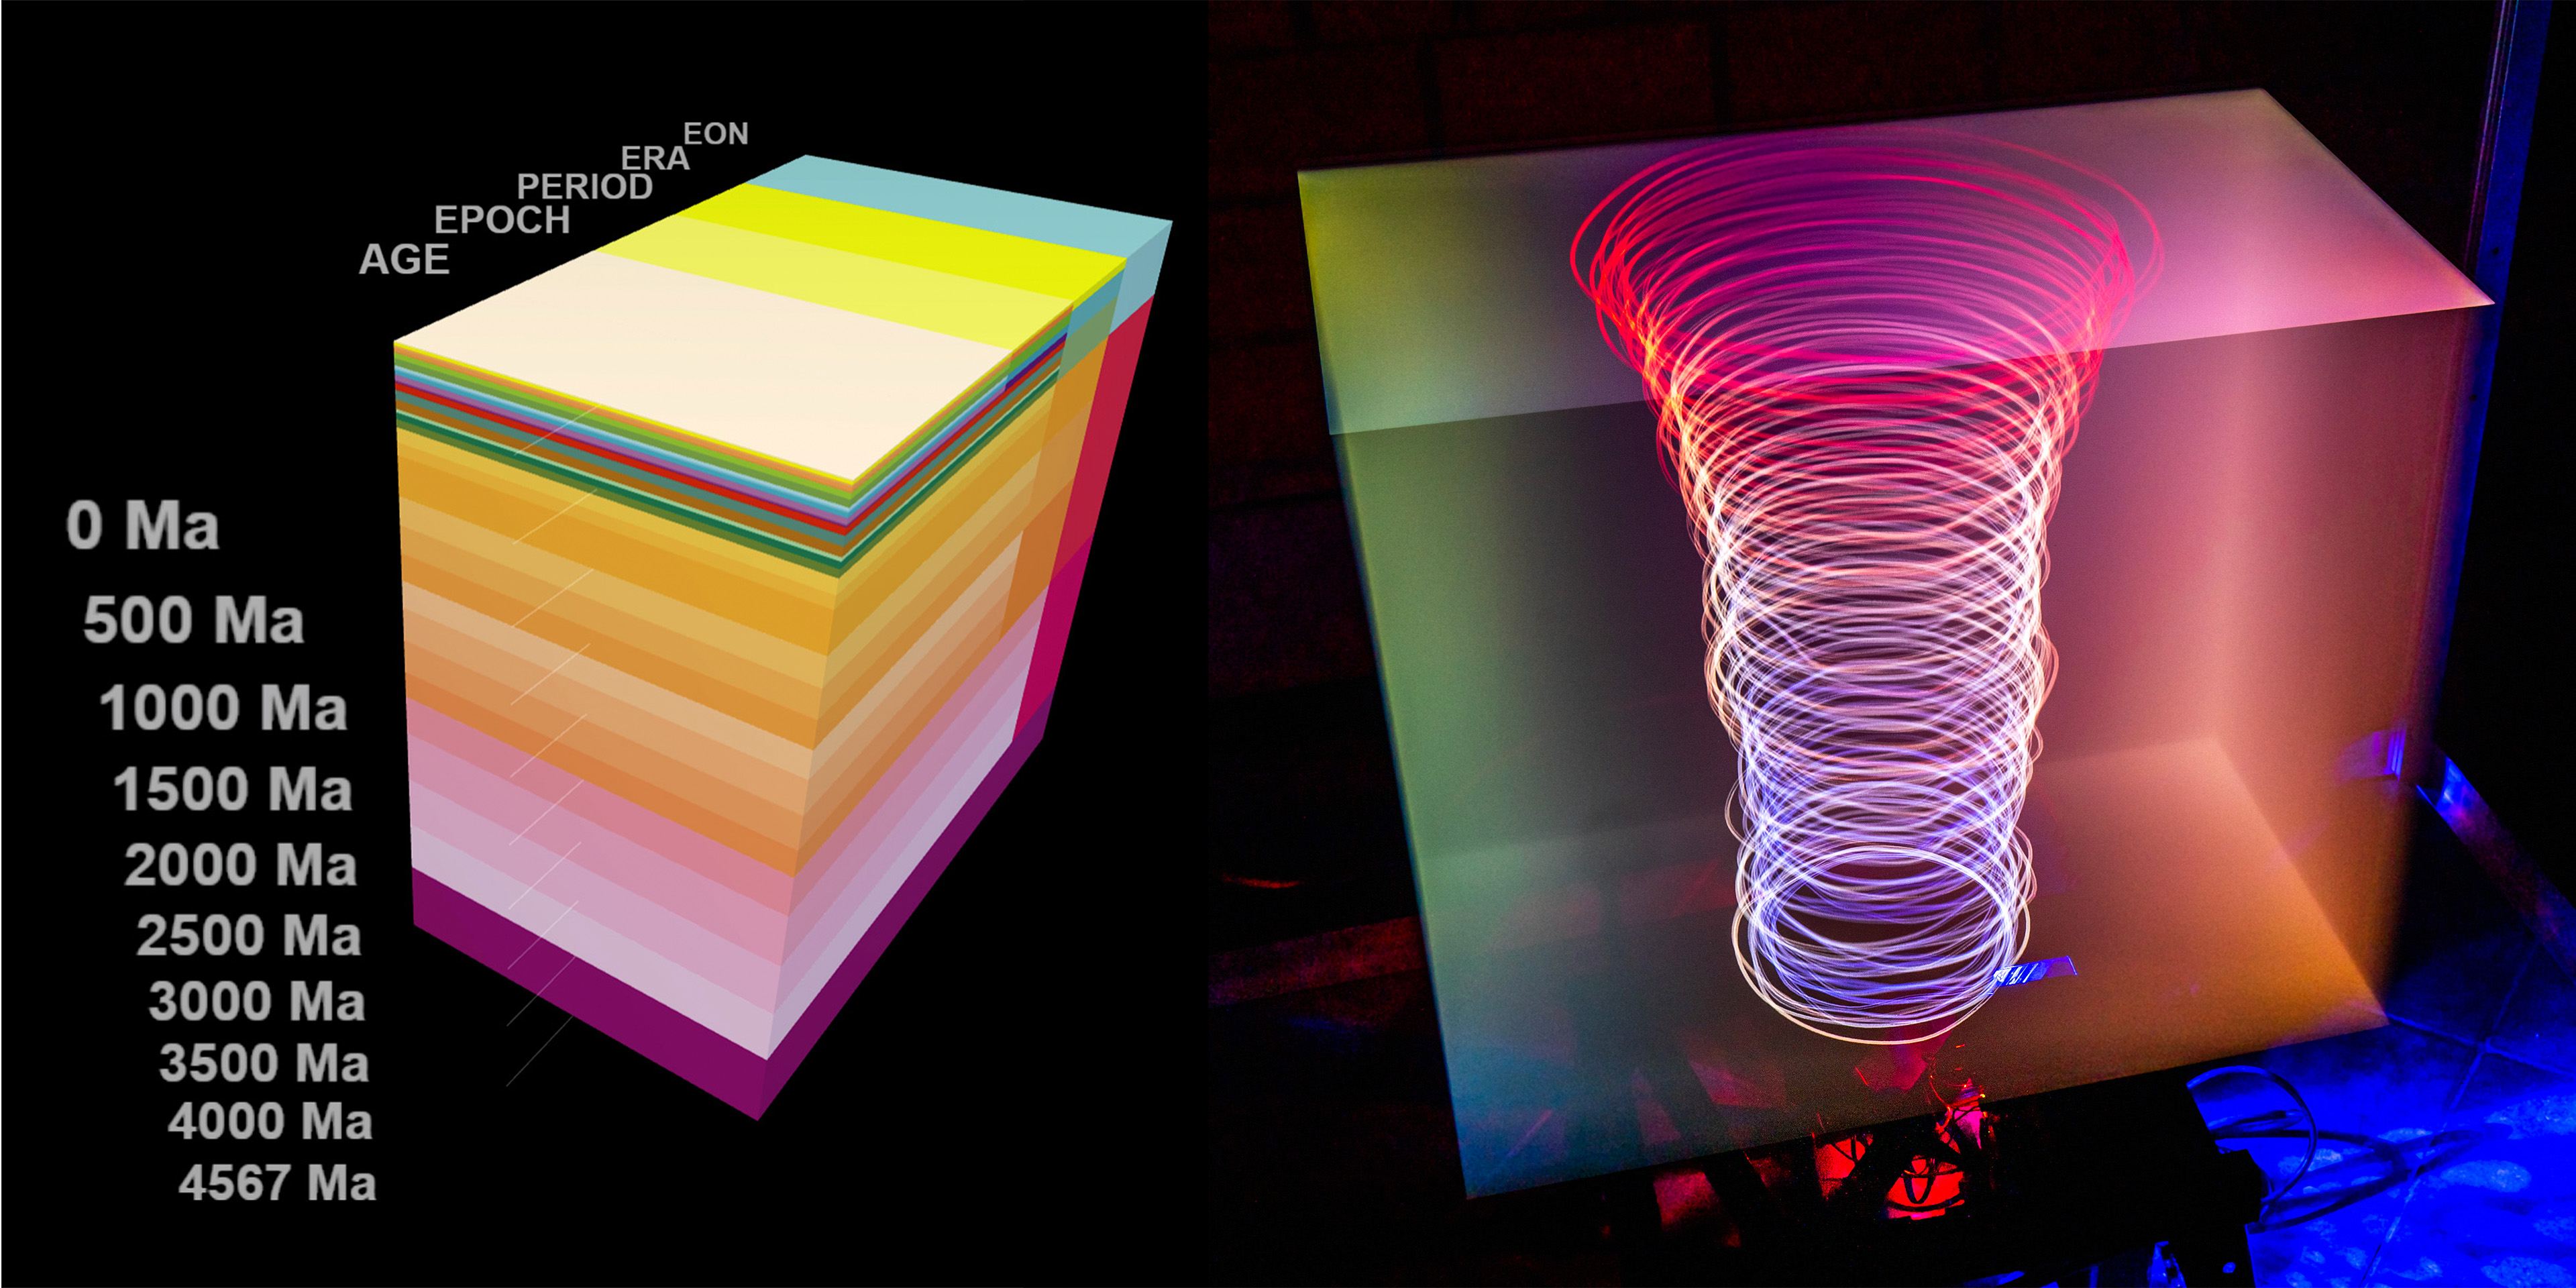
Another experiment used the display volume as a way to visualize time scales and datasets. To visualize the geologic timescale, I created a cuboid of the display volume size, colored using the standard color codes of the Commission for the Geological Map of the World. I also used the vertical axis as a time axis for a global average temperature visualization, where each coil represents a year, and the radius represents the temperature deviation from the 1951-1980 baseline.
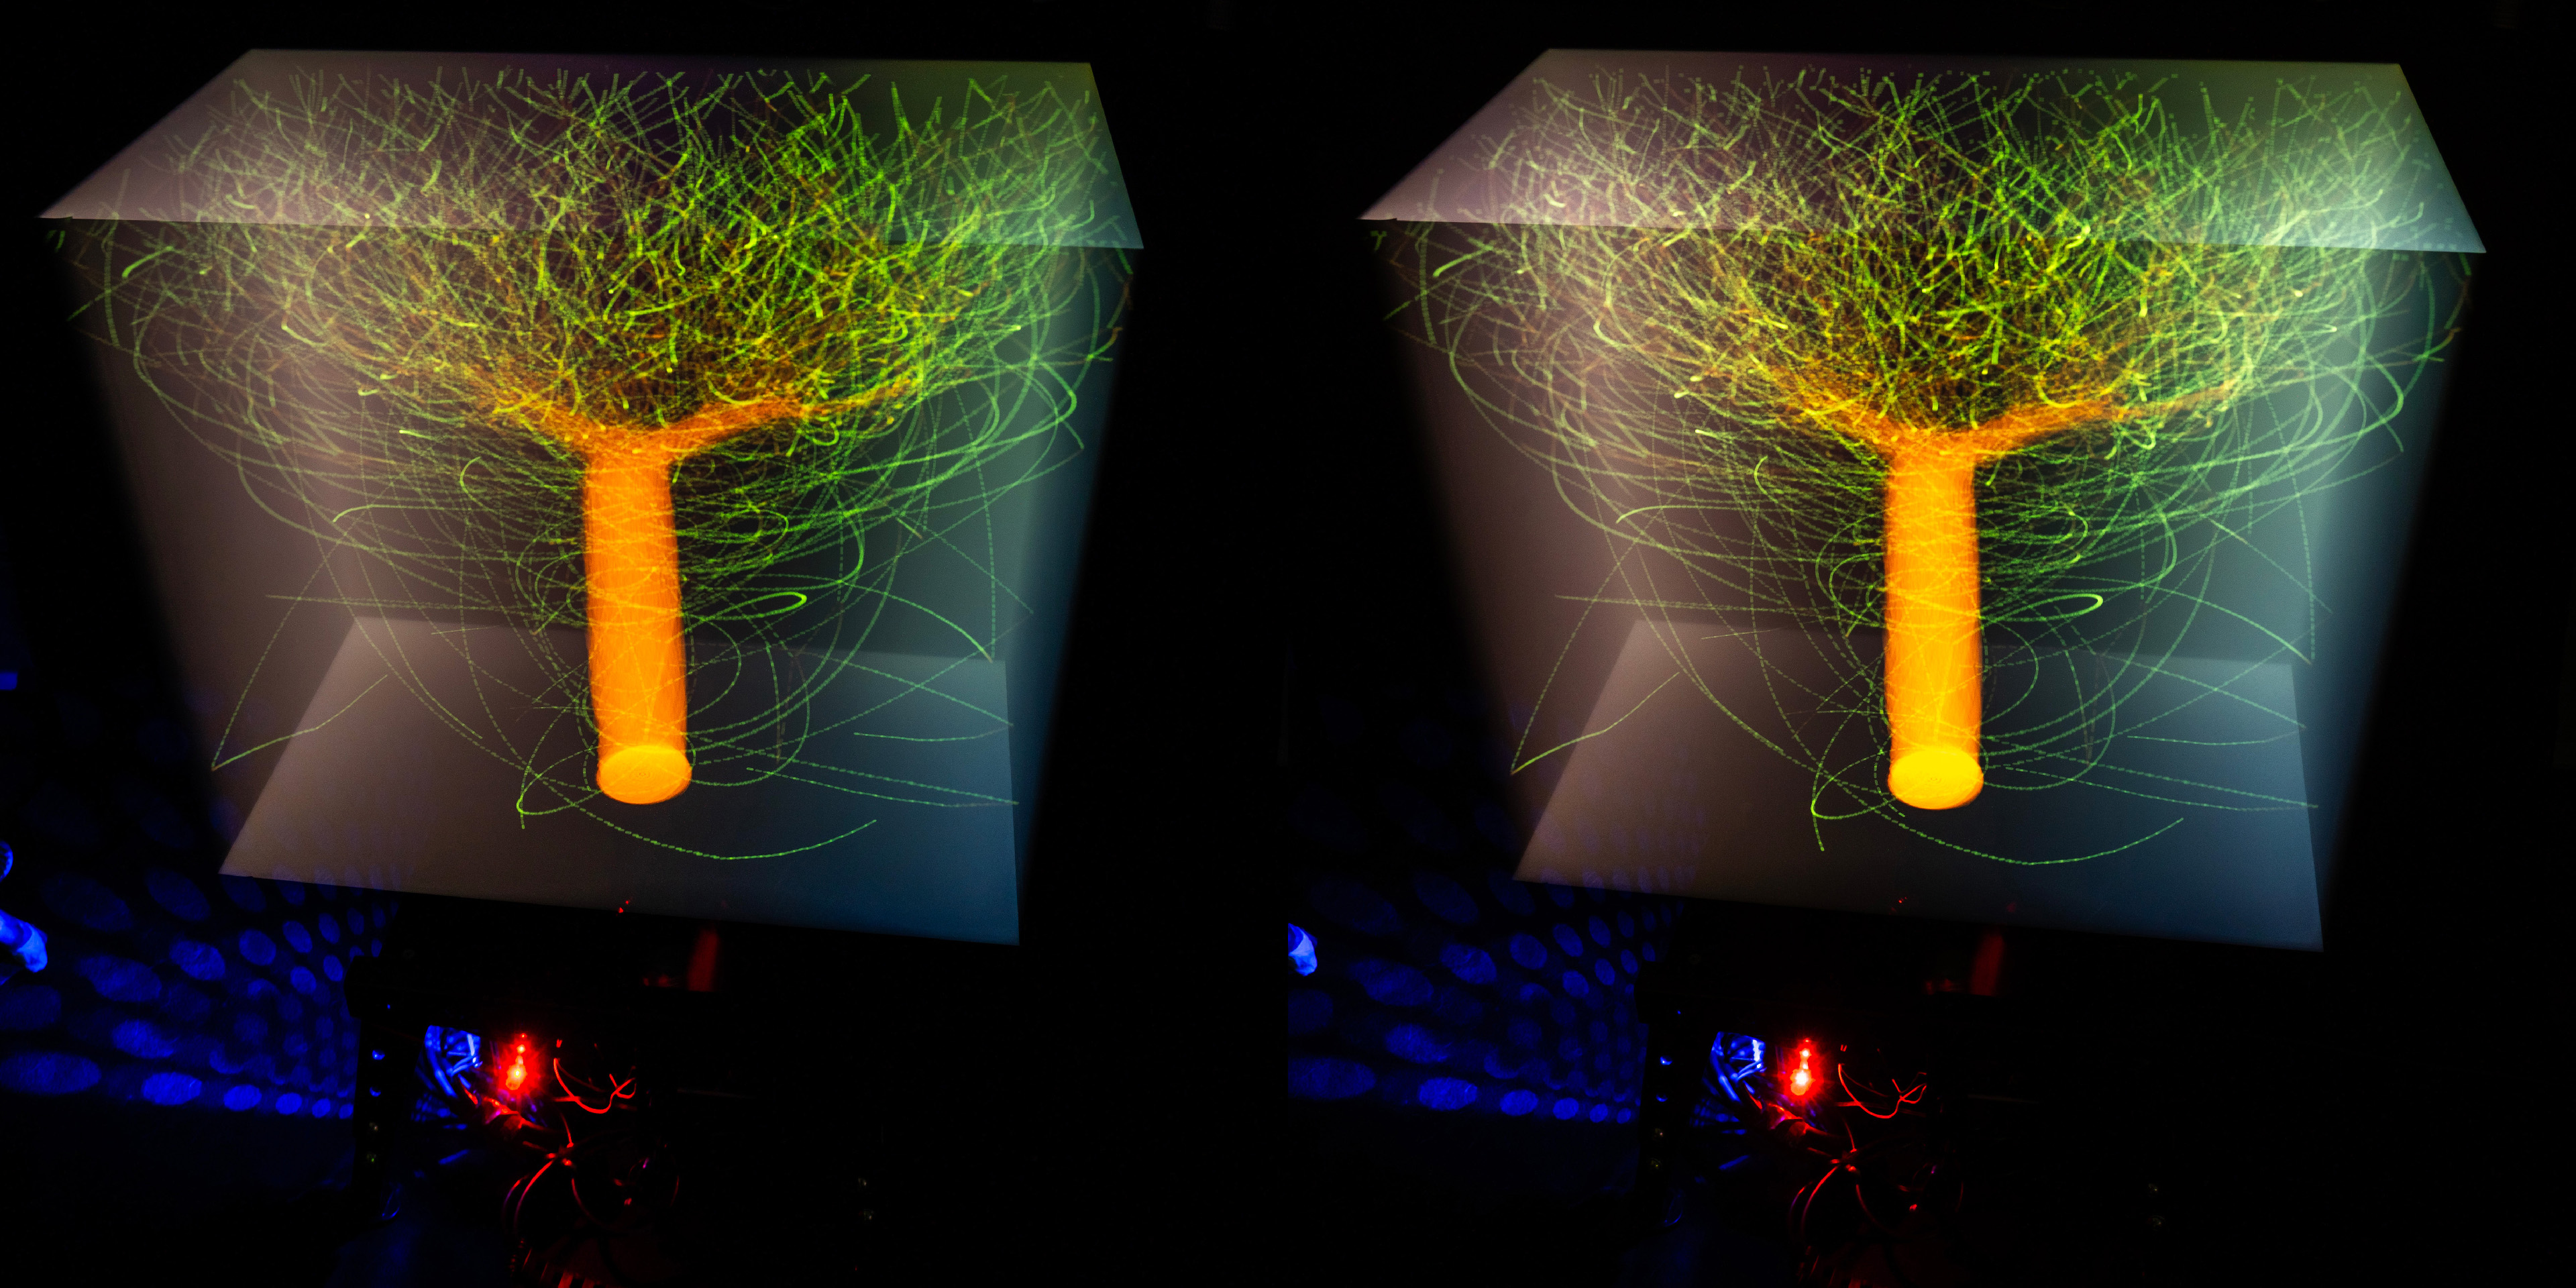
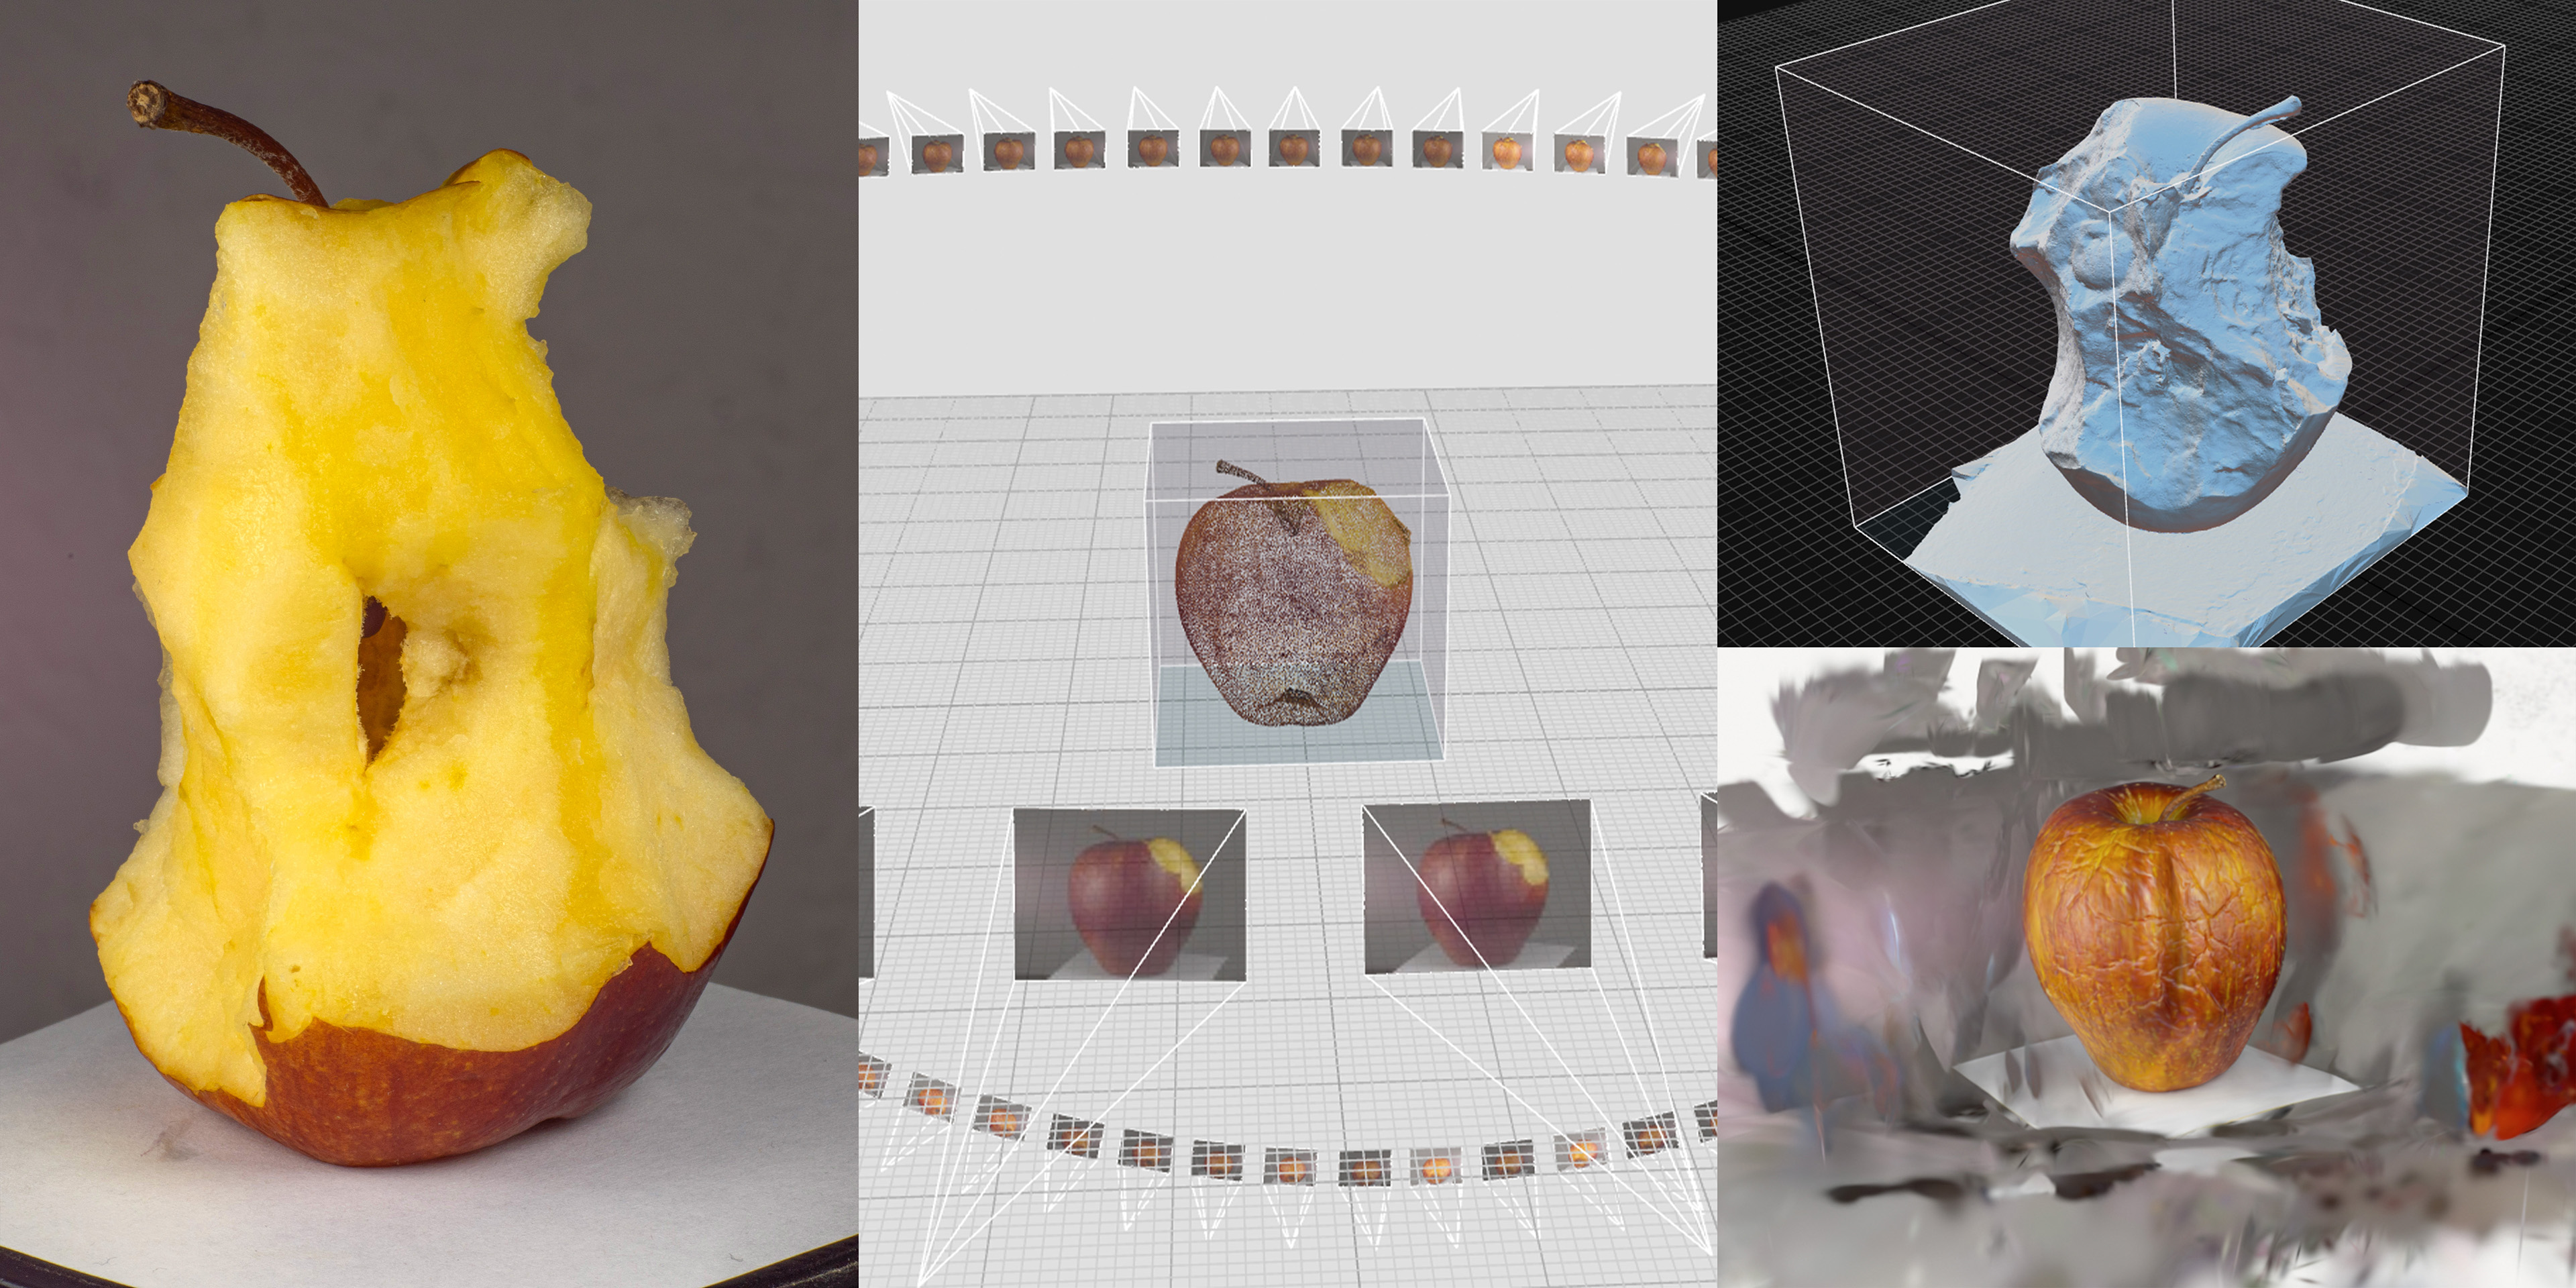
One of these time-based experiments began as an attempt to make a time-lapse video in 3D space. As a test, I used photogrammetry to scan an apple, taking a bite out of it between each scan. I put the apple on a turntable with controlled lighting and took 150 photos while it rotated 360°, then flipped the apple 90° and did another rotation. I did this about ten times, until only the apple core was left. After developing the raw files, I aligned them, generated point clouds, reconstructed their meshes, and projected their textures in RealityCapture. I then cleaned and simplified the scans and aligned them in Blender.
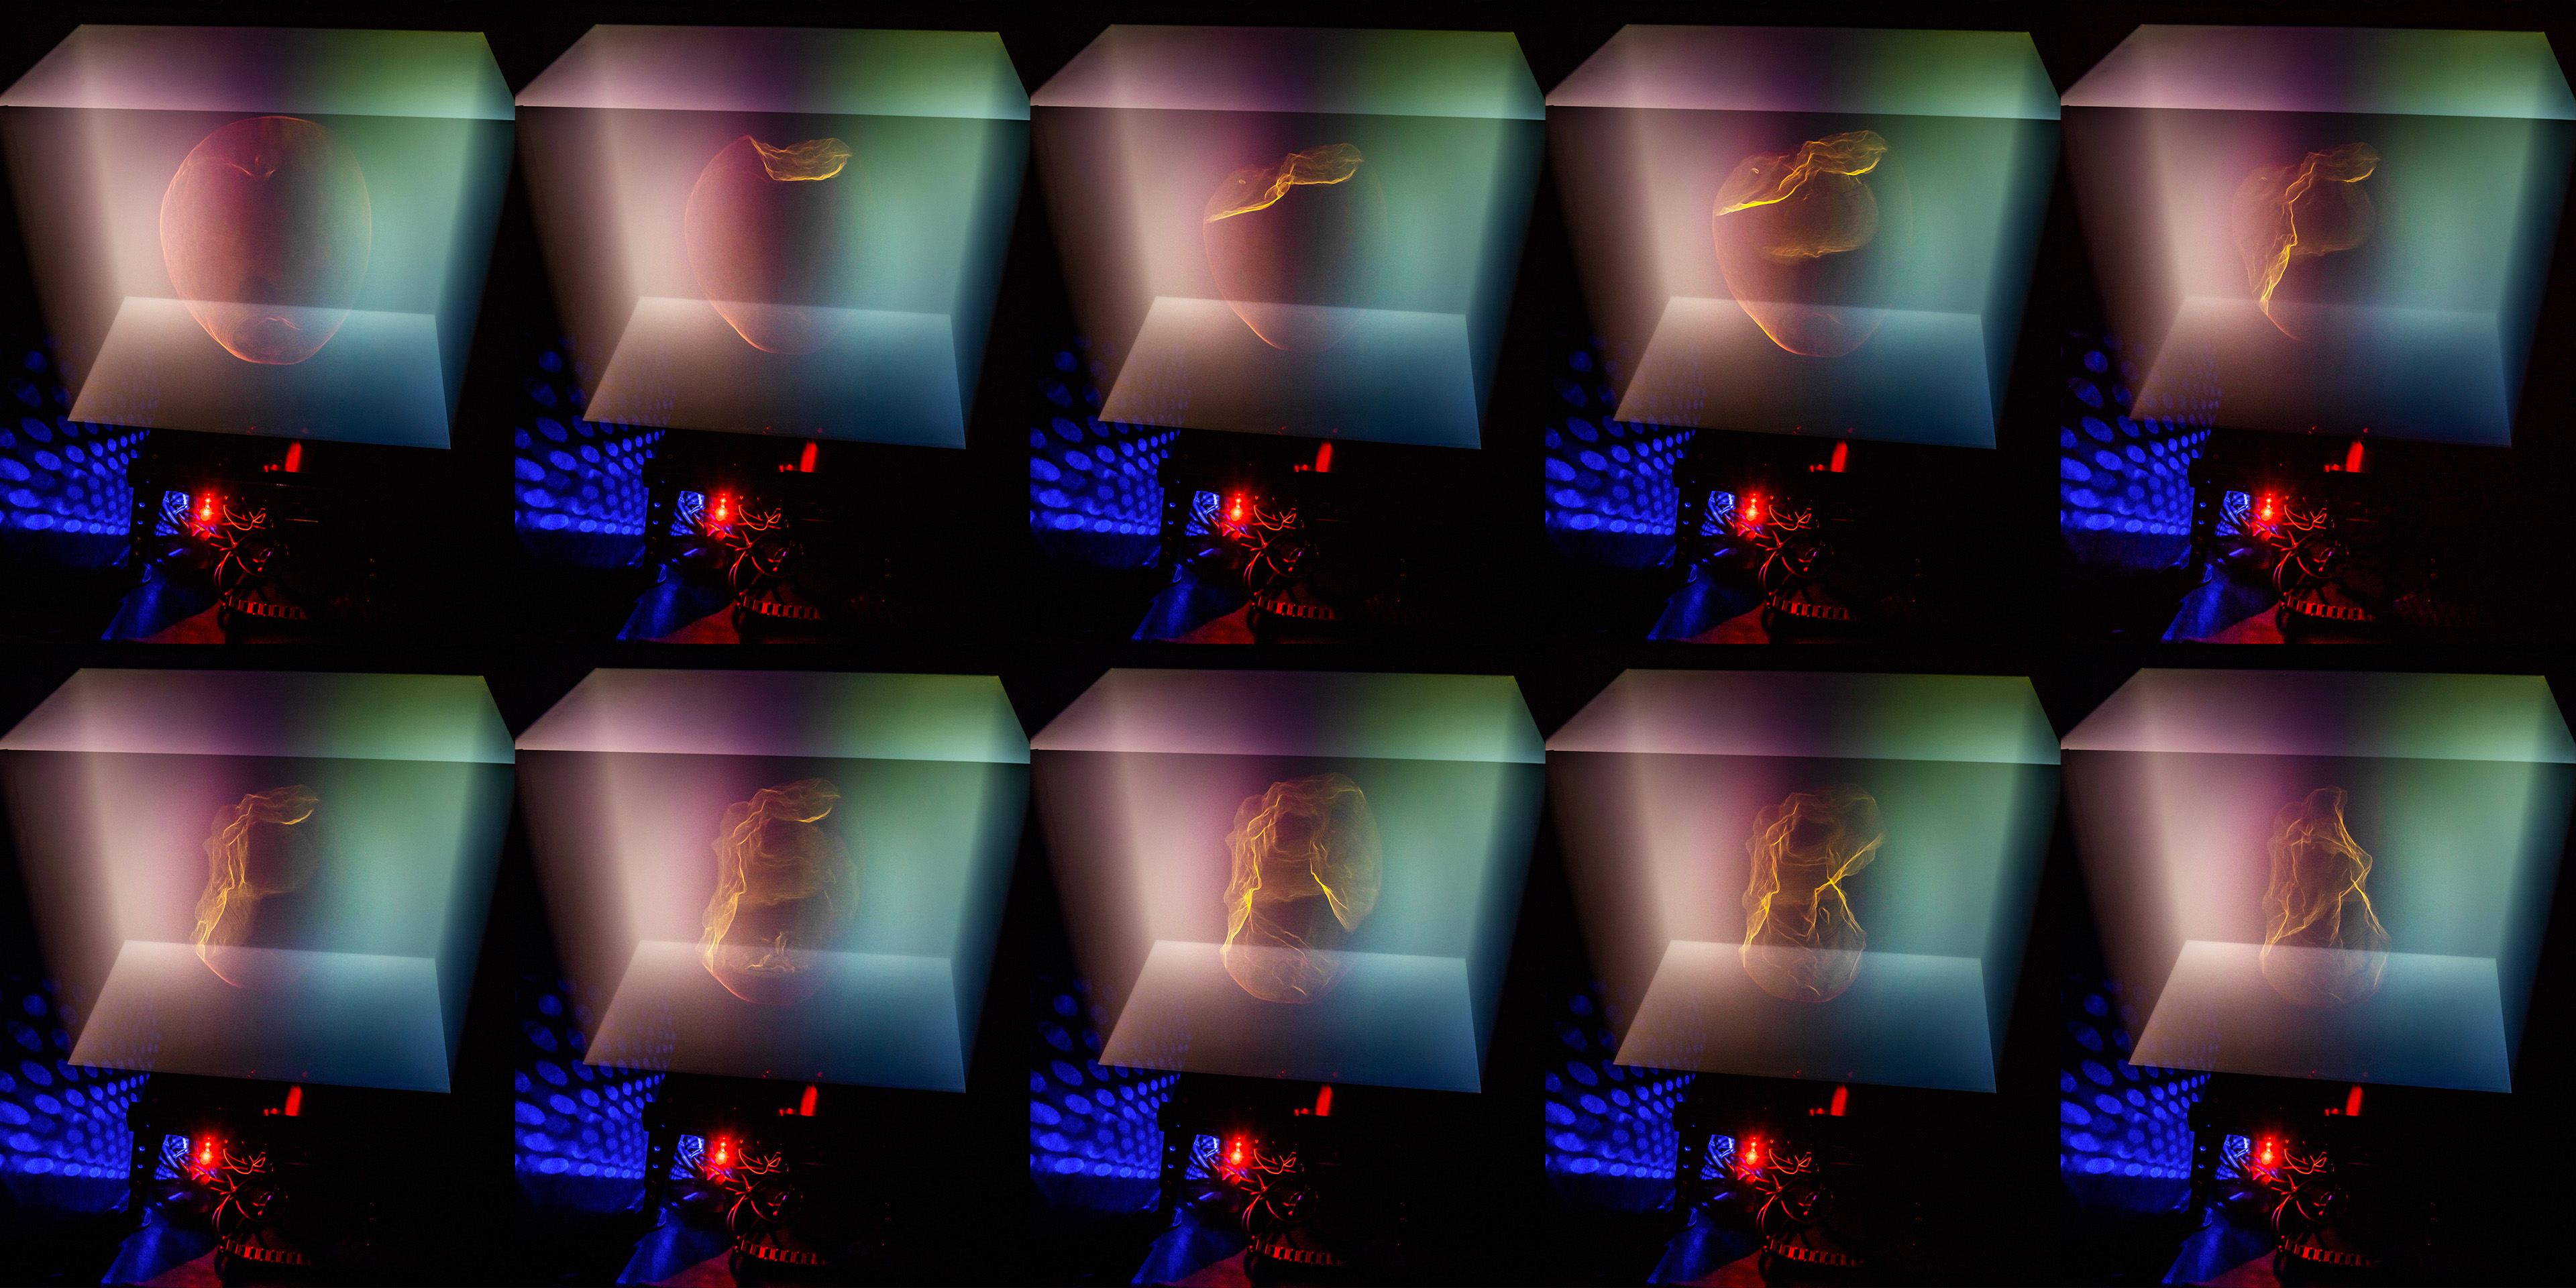
For Volumetric Time, I sliced the generated 3D models into image sequences and took long-exposure photos of each stage, turning the earlier 3D time-lapse experiment into a short animation of the apple being eaten.
The LCD screen still shows visible backlight bleed, especially at shallow angles. This makes faint objects and point clouds hard to capture. I tried using polarized filters in front of the camera to remove the bleed, but that also removed the light of the image coming from the monitor.
A more costly OLED screen would reduce this glow and improve the image quality. However, static elements such as QR codes could create a risk of burn-in.
A dedicated camera app with custom settings would also improve image quality and help compensate for the backlight glow, because it would allow more direct control over exposure settings. However, this would also make the interaction less immediate, because visitors would have to download and install an app before using the installation. The browser-based camera app is technically more limited, but it makes the experience much easier to access. Painting the lift black already helped reduce unwanted glare, but a black elastic fabric connecting the monitor with the dodecagon ring could block any reflections from the lift, the floor, or the ring, which could show up in the volume. Unlike the earlier loose fabric test, this cover would be constrained, so it cannot enter the scissor mechanism.
The actuator damping helped slightly, but I still see room for improvement there. I could cover the actuator with soundproofing foam or replace it with a quieter drive mechanism. This would make the installation feel calmer and would make it less distracting during longer exhibitions.
I already replaced the heavy original top plate with a custom aluminum one, but I could make it even lighter by replacing other parts. This would improve portability, which would be great if I want to take photos of it in different environments.
So far, I have tried to isolate the volume from its surroundings by using relatively neutral or black backgrounds. It would be interesting to see these structures interact with different, maybe outdoor, environments through reflection, scattering, and refraction of the light of the volume.
I could also create stop-motion animations from a series of 3D frame sequences. This might be more suitable as a standalone video than as an installation mode.
Another possible direction would be to integrate dedicated cameras and extra screens into the installation instead of relying on visitors’ phones. I experimented with a camera directly connected to the Raspberry Pi, so the system could synchronize the recording and display the result on the main monitor after its motion. I decided not to use this in the final version because it would have made the setup more complex and expensive, and would have reduced the participatory aspect of visitors using their own phones.
To make the installation more interactive, I could add a camera that captures and extracts visitors’ movements and turns them into a 3D time volume. This would connect the idea of time-based image stacking more directly to the people in the space: the visitors would not only photograph the installation, but also become part of the generated volumetric image.
The current version already demonstrates the basic principle, but future versions could make the system quieter, more portable, more optically controlled, and more responsive.