Climate Spiral
2026DESCRIPTION
In this project, I programmed an interactive 3D visualization of climate data. Each turn of the spiral represents a year, with the months arranged around its center and the values determining the distance from it.
My goal was to make seasonal patterns and changes over successive years visible within the same form, and to keep the visualization current as new observations become available.
The project builds on the climate spiral introduced by Ed Hawkins in 2016. I created an interactive version that lets the user move around the visualization, change the dataset, and switch between a spiral and an unwrapped view.
Seen from above, the years overlap like rings, showing how the values change at different points in the calendar. In the default temperature view, color also follows the value, with cooler anomalies shown in blue and warmer ones in red.
When viewed from the side, the years are separated vertically. The same line becomes a spatial record that can be rotated and examined from different angles. Moving between the views changes which relationships become easiest to see, while the underlying observations stay the same.
The animation draws the record month by month. It can be paused and moved backward or forward, making it possible to look at one part of the record or watch how the whole shape develops over time.
Keeping the data current was also important to me. I set up a GitHub Actions workflow that checks the main climate datasets every week, downloads the latest files, validates them, and saves any changes automatically. The visualization can keep growing with new observations without relying on me to update the data by hand.
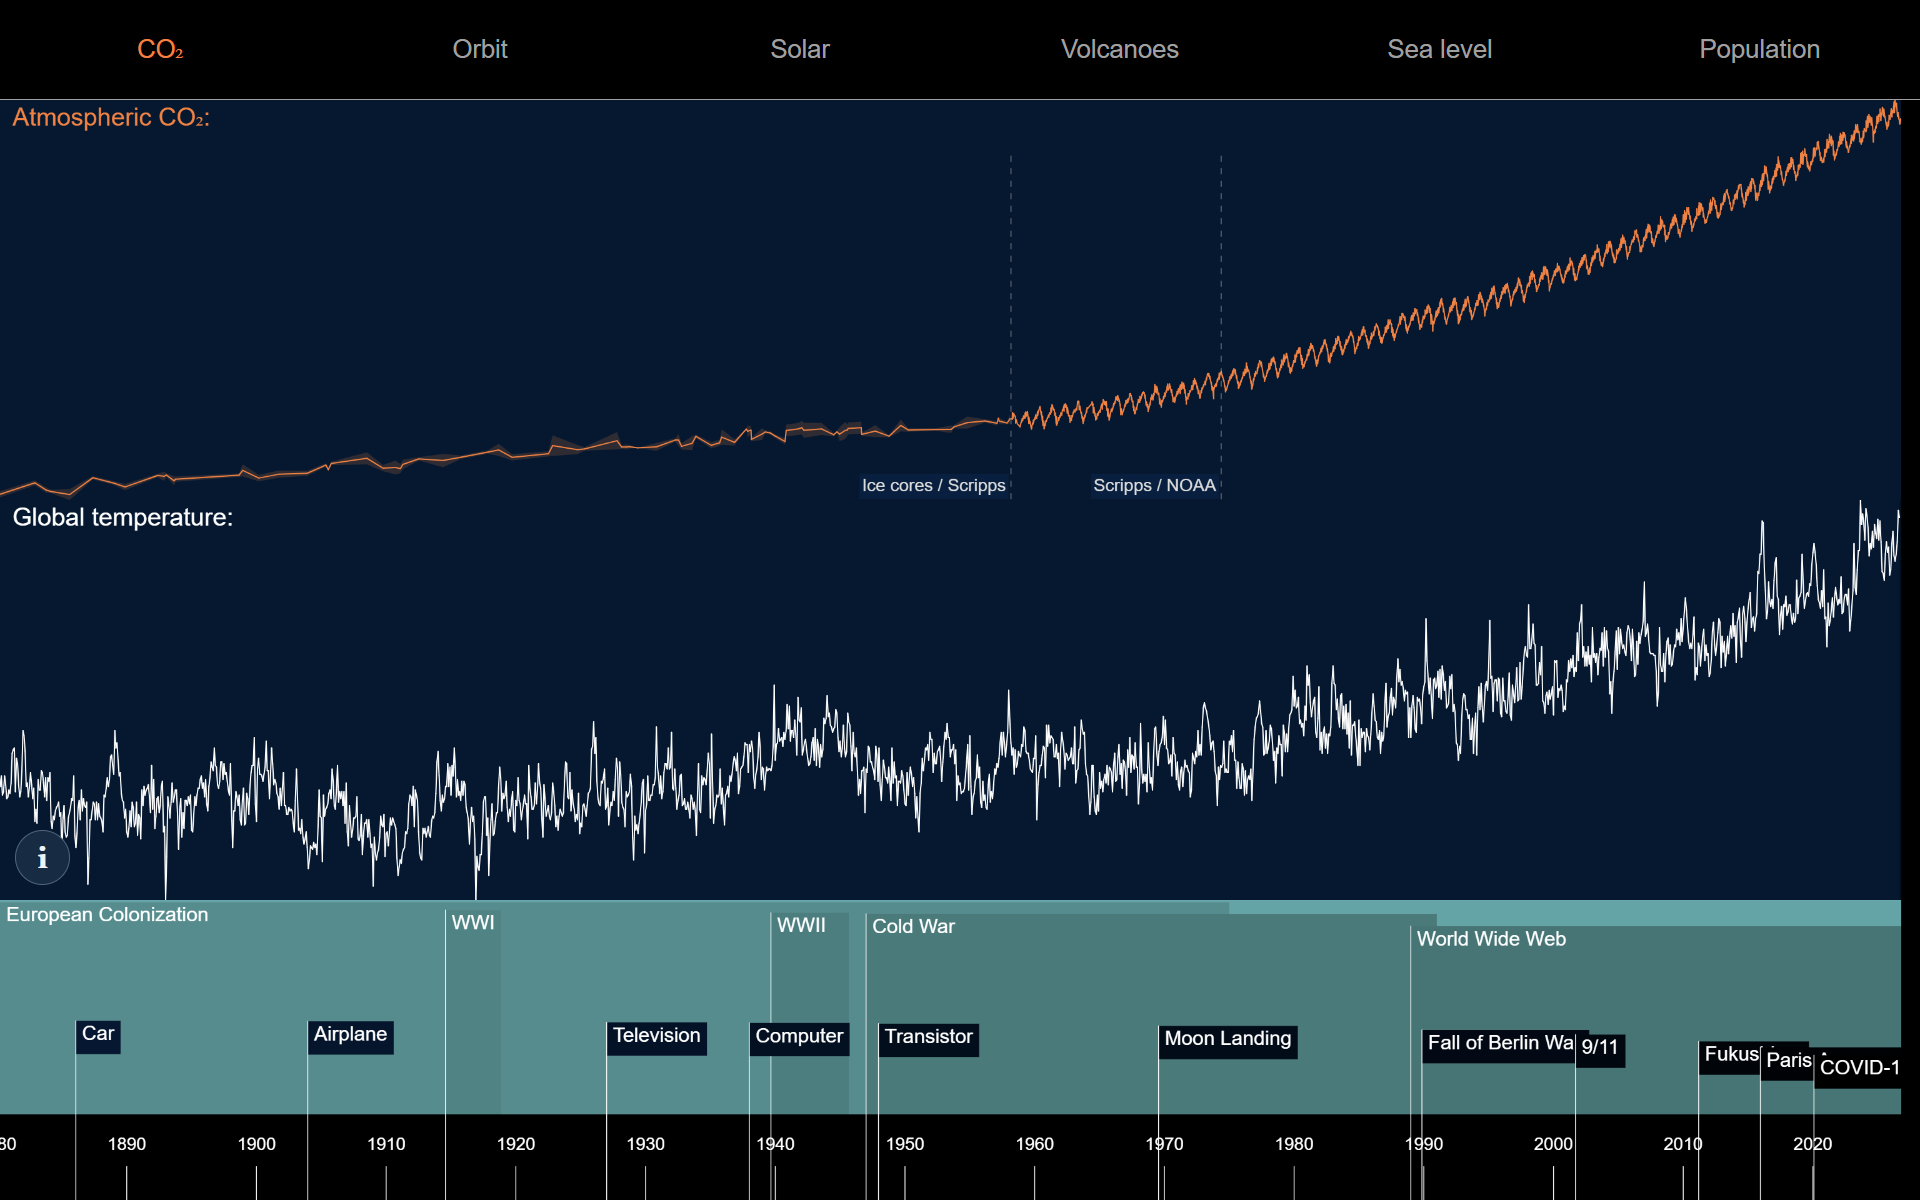
This project sits alongside Deep Record, which explores climate history across a much wider time range. Here, I focused on the repeating structure of the year and the changes that accumulate across those repetitions.