Deep Record
2019–2020DESCRIPTION
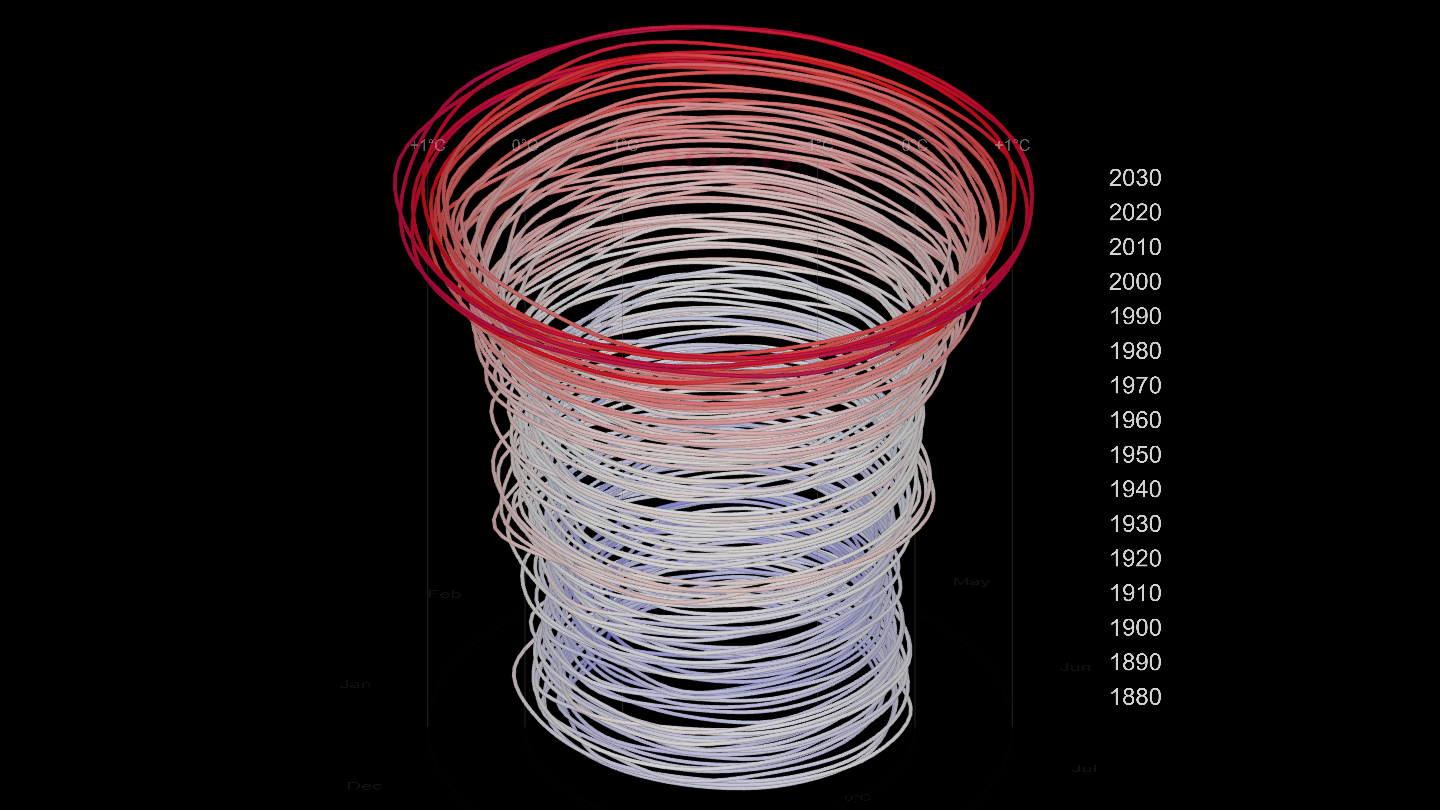
In this project, I programmed an interactive visualization of climate history. Different datasets can be compared with global temperature while zooming between recent observations and the distant past.
My goal was to make the time scales of these changes easier to understand and relate them to human experience.
I started Deep Record in 2019 and developed the original program in Processing during the winter semester of 2019/20. The interactive version shown here is a later adaptation for the browser.
While researching climate change, I was interested in the argument that the climate has always changed. I wanted to look more closely at the factors involved in these changes and how they relate to the time in which they happen.
Climate reconstructions often show graphs with different time scales next to each other. This makes it possible to show both the details of recent decades and the changes over millions of years without drawing an extremely long graph. But it also makes it difficult to get a sense of how these periods relate to each other.
I wanted to let the user stretch and compress the time axis themselves. At any point, the data is displayed on a linear scale, so equal distances represent equal amounts of time. The field of view changes logarithmically, allowing the user to move between very different scales without losing that relationship within the graph.
The temperature stays in the lower part of the screen. Above it, other datasets can be selected for comparison. A timeline underneath the graphs shows historical events and periods, giving familiar points of reference as the view moves further into the past.
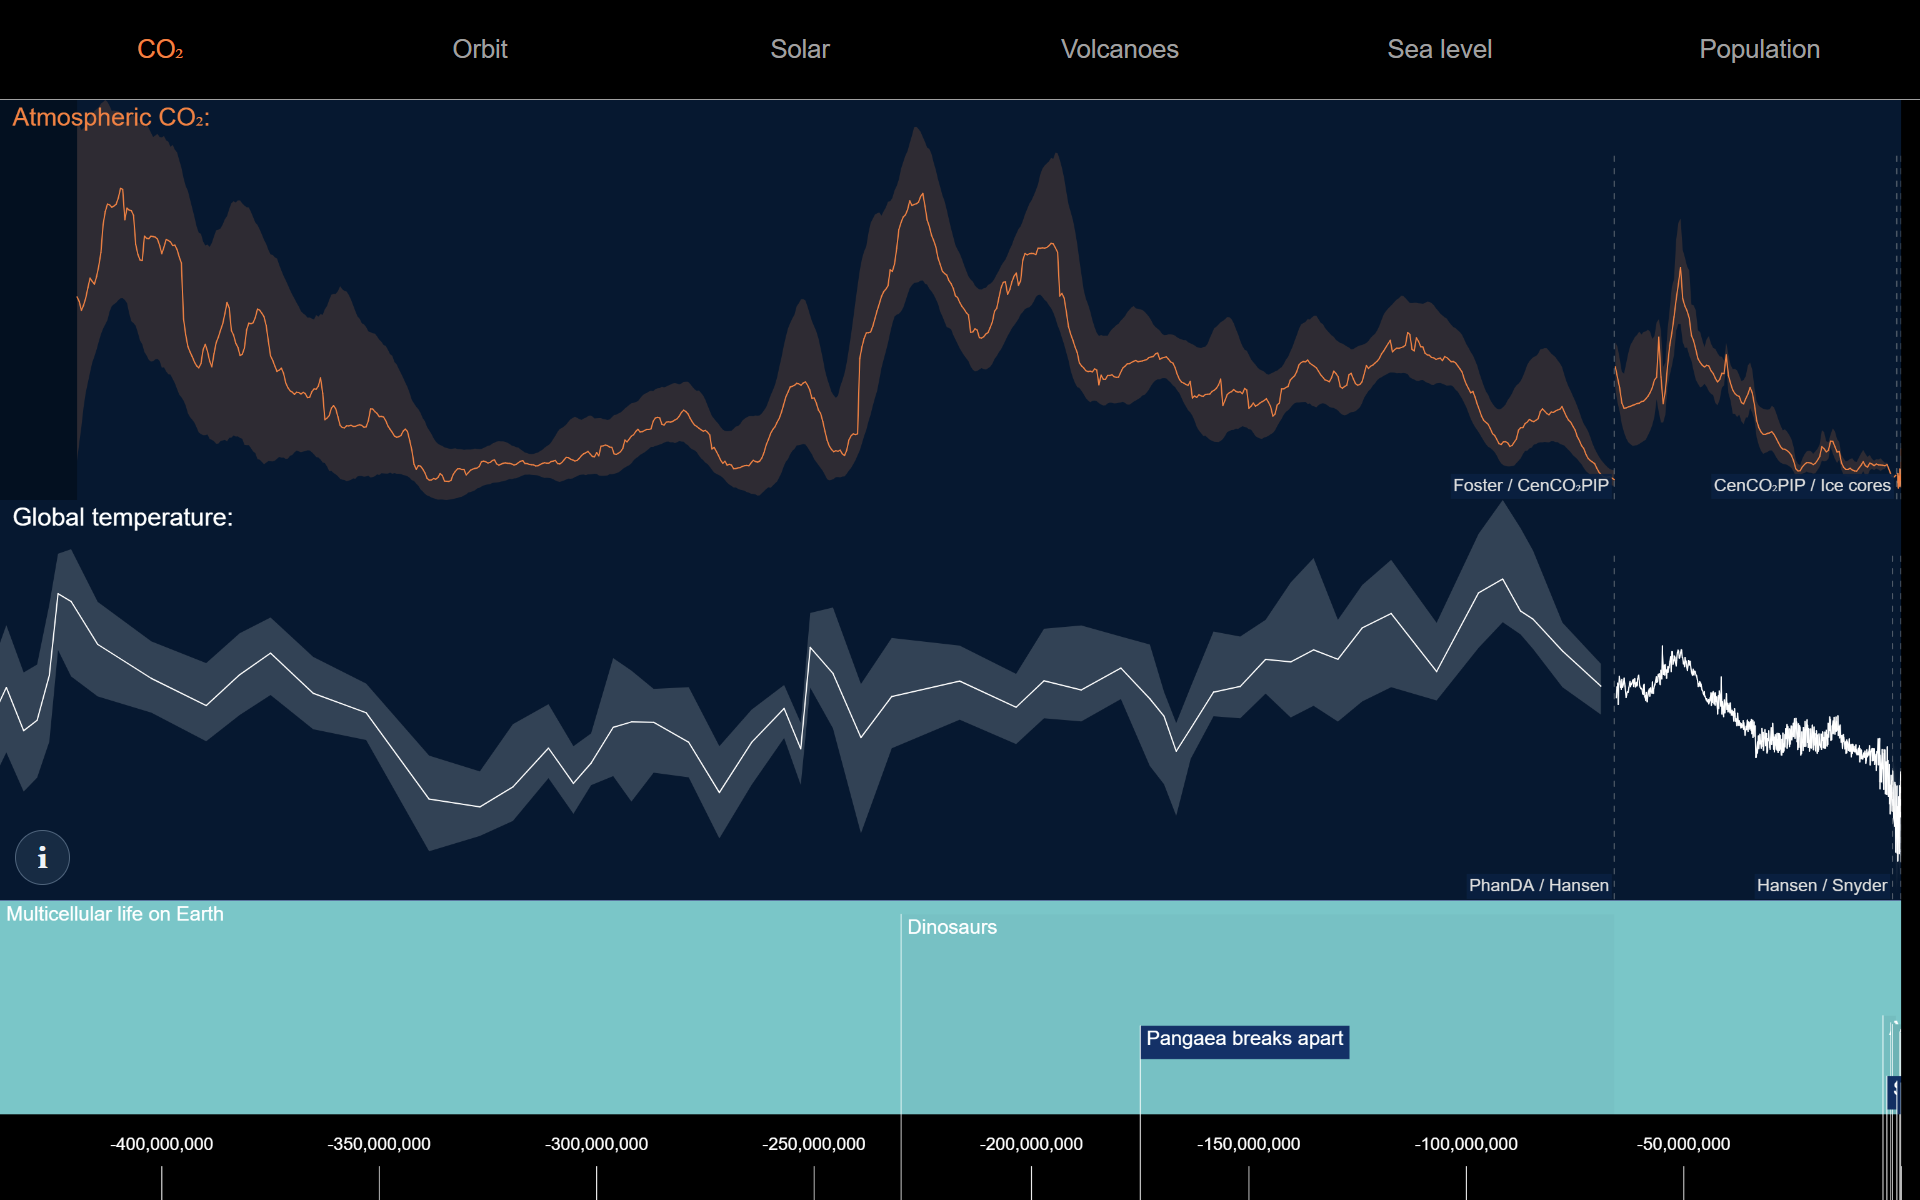
Web version, shown at a wider time scale.
The question of how we understand time later continued in Time Scale, where I expanded the idea beyond climate data to explore durations, cycles, and events in both the past and the future.